Trading Accounts
Trading Conditions
Financials
CFD Trading instruments

Don’t waste your time – keep track of how NFP affects the US dollar!
The ASIC policy prohibits us from providing services to clients in your region. Are you already registered with FBS and want to continue working in your Personal area?
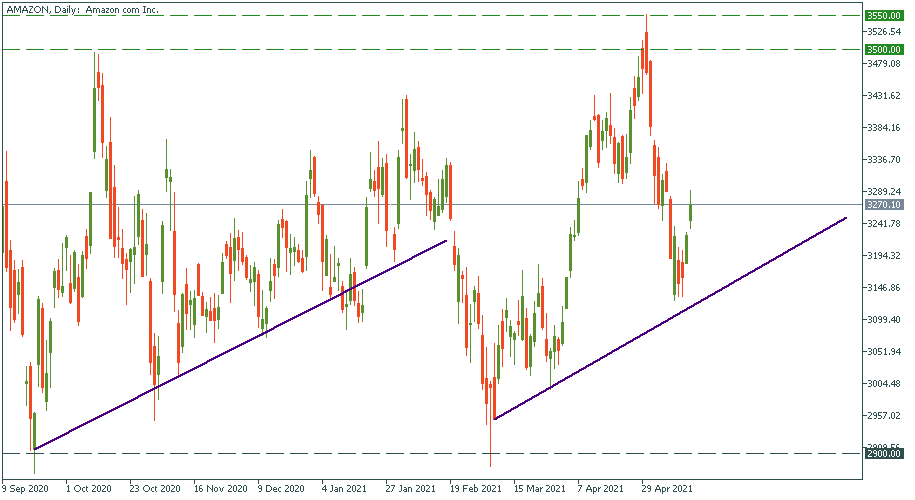
Personal areaDaily chart of the Amazon stock price performance shows us a very clear sideways channel that has been there since August 2020.
The zone above 3500 provides resistance and has sent the price downward already two times in the course of the last nine months. The beginning of May was the most recent one.
The band 2850-2900 provides support and made the price revert twice since last summer.
The stock doesn’t really go sporadically within the boundaries of the channel. As you can see, it tends to plunge fiercely and then start a new upswing in a steadier manner rising at a constant angle relative to the channel boundaries.
If nothing changes in the dynamics of this stock, we’re up for another upswing that’ll likely reach 3500.
Projecting the same pace and angle of ascension into the future, it should take around three months for the stock to get there. Hence, it’s a long-term game.
If you’re ok to hold the stock for a couple of months, buy it now, and hold it until it comes to 3500.
Over there, you’ll potentially make a minimum of 10% gain if the scenario is completed.