Trading Accounts
Trading Conditions
Financials
Trading Instruments
Feel the Team Spirit


Don’t waste your time – keep track of how NFP affects the US dollar!
The ASIC policy prohibits us from providing services to clients in your region. Are you already registered with FBS and want to continue working in your Personal area?
Personal areaBitcoin has gained more than 60% since the middle of July and reached $50.000. At the moment it looks like the trend lost its momentum and the crypto market will face a big correction. Let’s check the chart and determine potential targets and buyback levels.
Technical analyses
Long term period:
4H chart
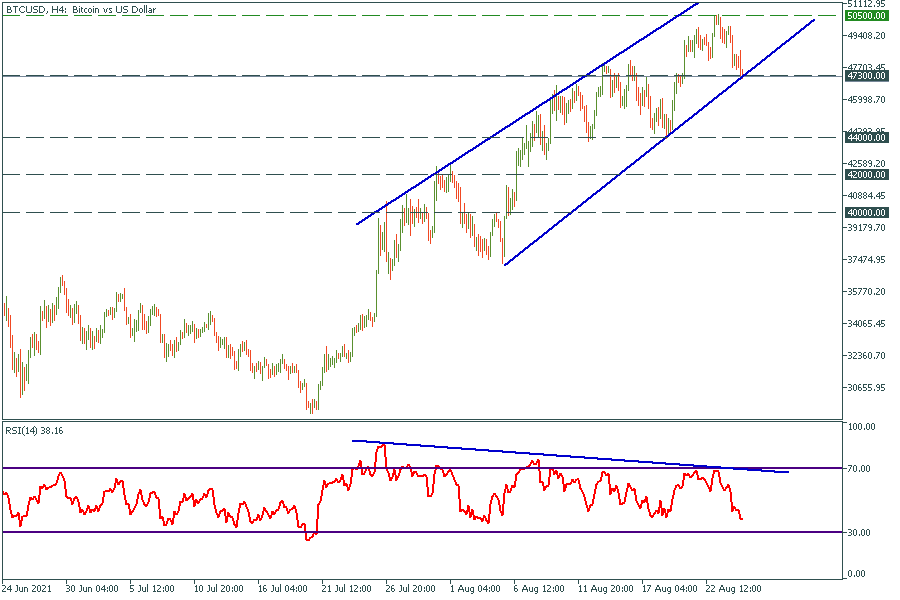
Bitcoin is moving in the rising channel. Last time it couldn’t reach the upper border of this channel, which is the first potentially negative signal. Moreover, there is a divergence on the RSI oscillator occurred.
Short term period:
30min chart

Bitcoin has formed the falling wedge pattern with the RSI divergence and the potential target at $49.700. In this case, a good choice might be to wait for the wedge breakout and open a long trade after.
If Bitcoin plays out the scenario with the falling wedge pattern and goes towards the previous high, the potential short entry point will be in the $50.000-$50.500 range. Otherwise, as soon as Bitcoin breaks through the bottom line of the channel the price will go towards $44.000 and lower.
Resistance range: $ 50.500 – 50.500
Support levels: $47.300; $44.000; $42.000; $40.000