Trading Accounts
Trading Conditions
Financials
Trading Instruments
Feel the Team Spirit


Don’t waste your time – keep track of how NFP affects the US dollar!
The ASIC policy prohibits us from providing services to clients in your region. Are you already registered with FBS and want to continue working in your Personal area?
Personal areaS&P500 Daily chart
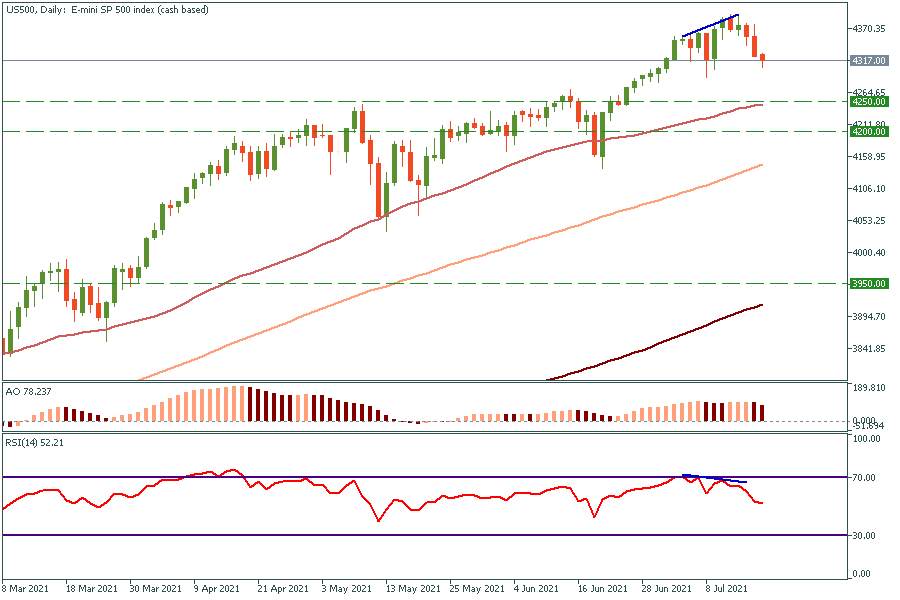
S&P500 has shown its weakness during the last two weeks and the historical data says the correction is not over yet. Ever since the market had crashed in 2020, we have seen several S&P500 corrections with one thing in common. During every correction, the price has been touching at least the 50-day moving average. This one would not be an exception. With the bearish divergence on a daily chart, the price will drop down to 4250 first. If this price breaks this support level, it will head towards 4200.
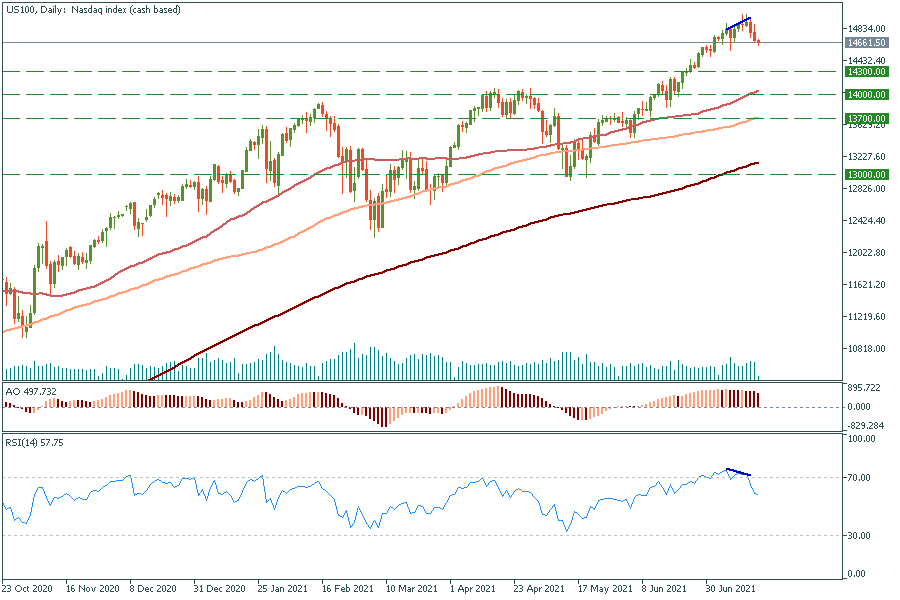
US100 Daily chart
US100 4H Chart
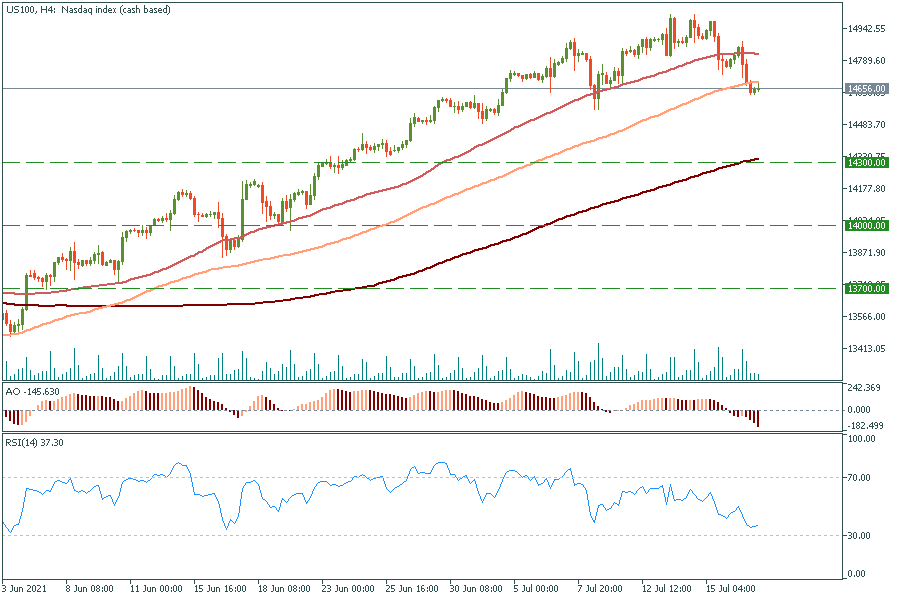
Nasdaq (US100) had been also falling during the last week. During last year during every correction, the price had been reaching 100-day moving average. With the bearish divergence on a daily chart, the price will aim towards the range between 13700 and 14000.