Trading Accounts
Trading Conditions
Financials
CFD Trading instruments

Don’t waste your time – keep track of how NFP affects the US dollar!
The ASIC policy prohibits us from providing services to clients in your region. Are you already registered with FBS and want to continue working in your Personal area?
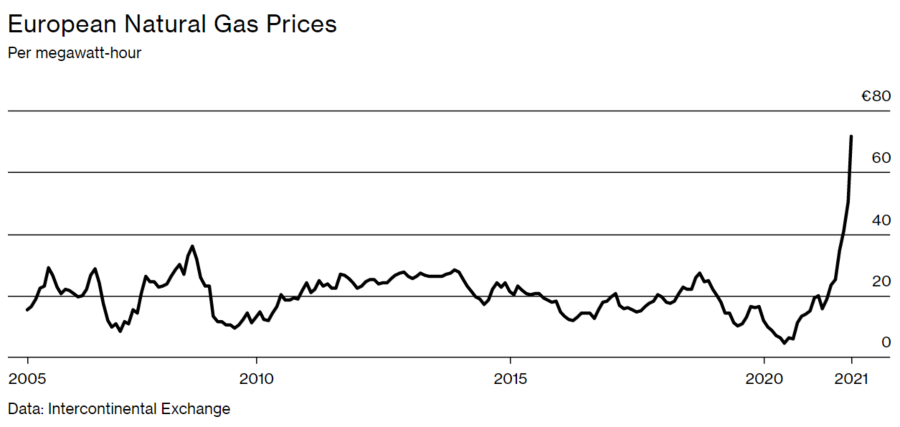
Personal areaAnalysts of HSBC revealed their outlook on energy prices. They expected the gas price to be “exceptionally high” this winter because a global shortage pushed some energy firms to close. Supply is going to be weak, while demand will rise sharply in the winter season, pushing gas prices even higher. According to Bloomberg, ‘European gas prices surged by almost 500% in the past year and are trading near record’. The high energy prices in turn forced producers in Europe to decrease production, which can lead to higher costs for farmers and potentially add to global food inflation.

Source: Bloomberg
A combo of strong demand and poor supply has sent oil prices to the high unseen since 2018. This winter is going to be good for oil suppliers but not for its consumers, who are switching from gas to cheaper oil. Vitol Group, the world’s largest oil trader, anticipates oil demand to rise by half a million barrels a day this winter. It will support oil prices.
There are oil and gas trading instruments that are becoming more popular among traders: XBR/USD (Brent oil), XTI/USD (WTI oil), and XNG/USD (gas).
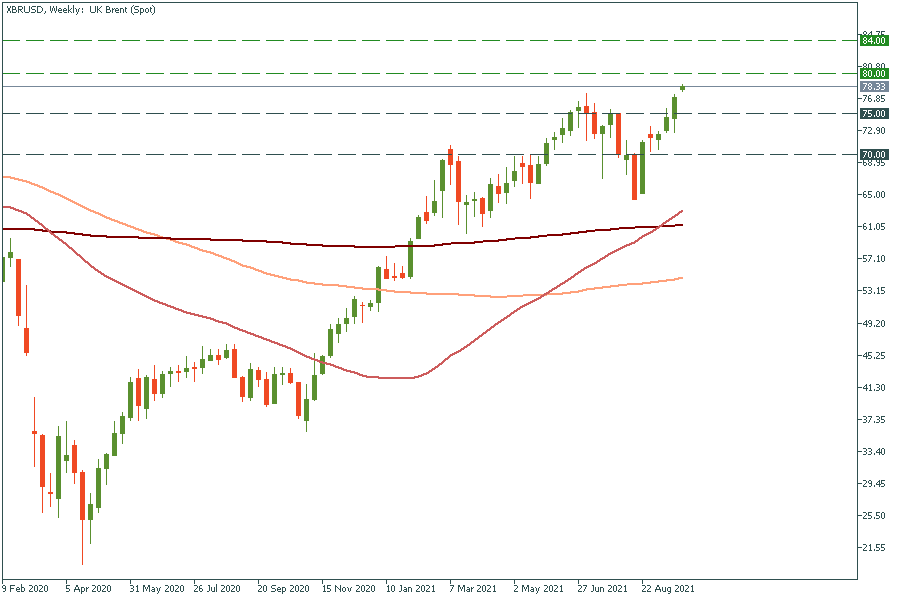
Just look at the XBR/USD. It has opened today with a gap up, getting closer to the psychological level of $80.00 a barrel. The jump above this mark will open the doors towards the three-year high of $84.00. Support levels are $75.00 and $70.00.

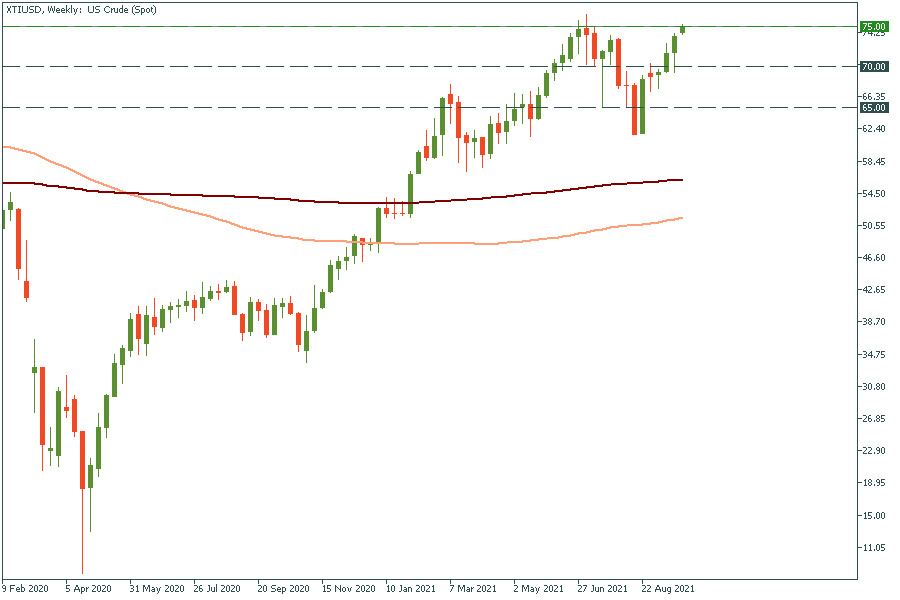
XTI/USD tends to move together with XBR/USD, but it has outrun its peer. It has already approached the three-year high, which is at $75.00. WE might expect a short pullback before oil prices will continue rallying up. When oil closes above $75.00, it may surge to $80.00. Support levels are $70.00 and $65.00.

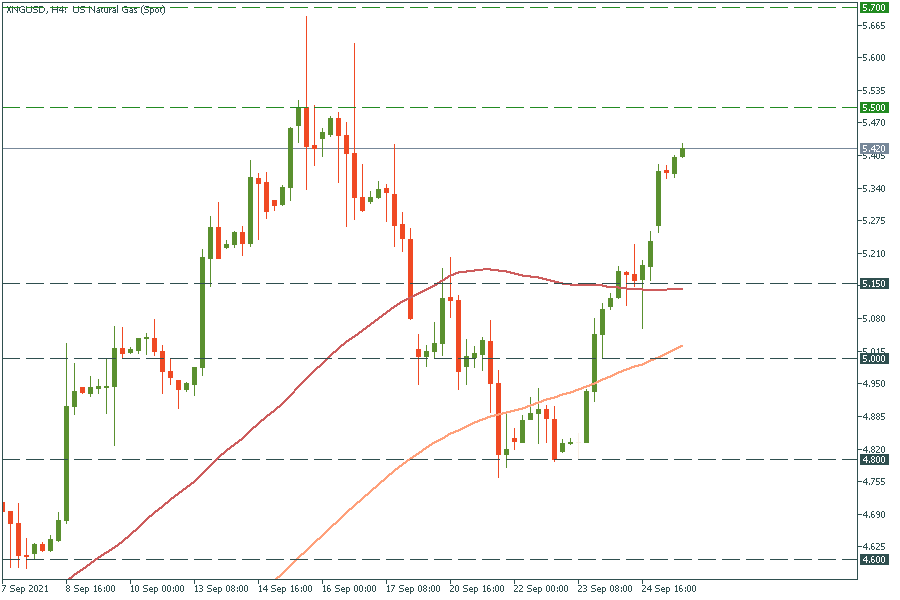
A cup and handle pattern has almost occurred on the XNG/USD chart. If gas breaks out the mid-September high of $5.50, it may rocket to 5.70! Support levels are at the 50 and 100-period moving averages: $5.15 and $5.00.
