Trading Accounts
Trading Conditions
Financials
CFD Trading instruments

Don’t waste your time – keep track of how NFP affects the US dollar!
The ASIC policy prohibits us from providing services to clients in your region. Are you already registered with FBS and want to continue working in your Personal area?
Personal areaOn Monday, July 19th, gold traded lower as the rising numbers of coronavirus cases drove investors to move their savings into safe-haven assets such as the US dollar and Treasuries. This fact proves that gold is not being a safe-haven asset anymore. The price movement of the past few months suggests gold is being thought of as a risky investment despite the fact its holders do not get any interest or dividend.
At the beginning of the month, gold’s price was driven by concerns about inflation and Federal Reserves’ policy, but Monday’s early price action suggests this week’s movement will be driven by fears over risk.
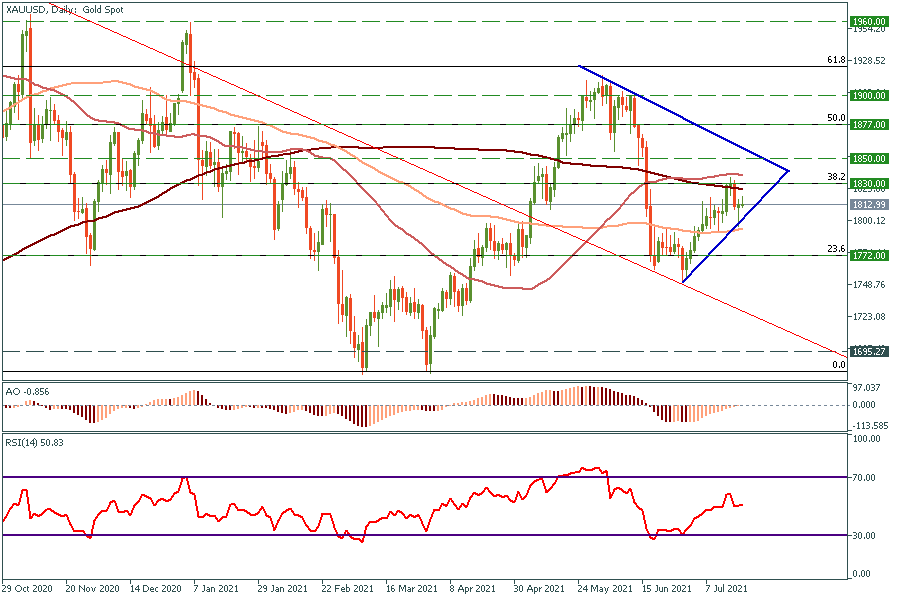
Daily chart

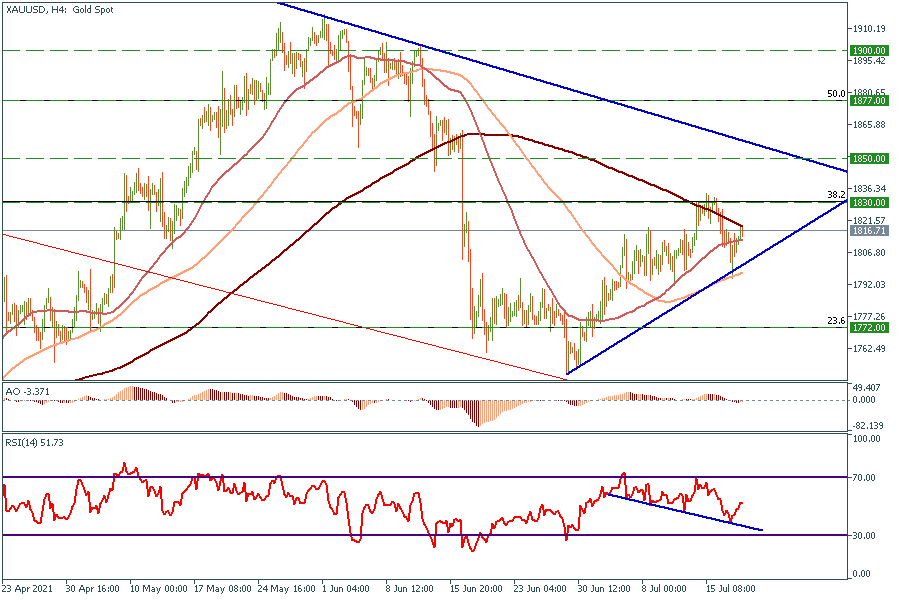
4H chart

At the moment, the XAUUSD chart is forming a symmetrical triangle. The price is trading under the 200-period moving average between $1772 and $1830, which are 23.6 and 38.2 Fibonacci levels, respectively. On the RSI oscillator, the bullish hidden divergence has been formed, which means the rising trend is going to continue.
Short-term trades:
If the price breaks the 200-period moving average, it will head towards $1830 and $1850 price levels.
On the other hand, in case the price stays under the 200-period moving average it will drop to the bottom side of the triangle.
Long-term trades:
We suggest trading a break through the triangle lines. Breaking through the top line gives the target price of $1900, on the contrary, the price will be dropped at the $1772 price level.