Trading Accounts
Trading Conditions
Financials
CFD Trading instruments

Don’t waste your time – keep track of how NFP affects the US dollar!
The ASIC policy prohibits us from providing services to clients in your region. Are you already registered with FBS and want to continue working in your Personal area?
Personal areaThe stock market keeps falling as investors concern over rising costs, supply-chain issues, and inflationary pressures as they can slow down the economic recovery. Besides, the market sentiment is pressed down by the situation with the indebted property developer China Evergrande Group. Finally, investors await the Federal Reserve to start tapering as soon as next month, which can cause additional sell-off in stocks.
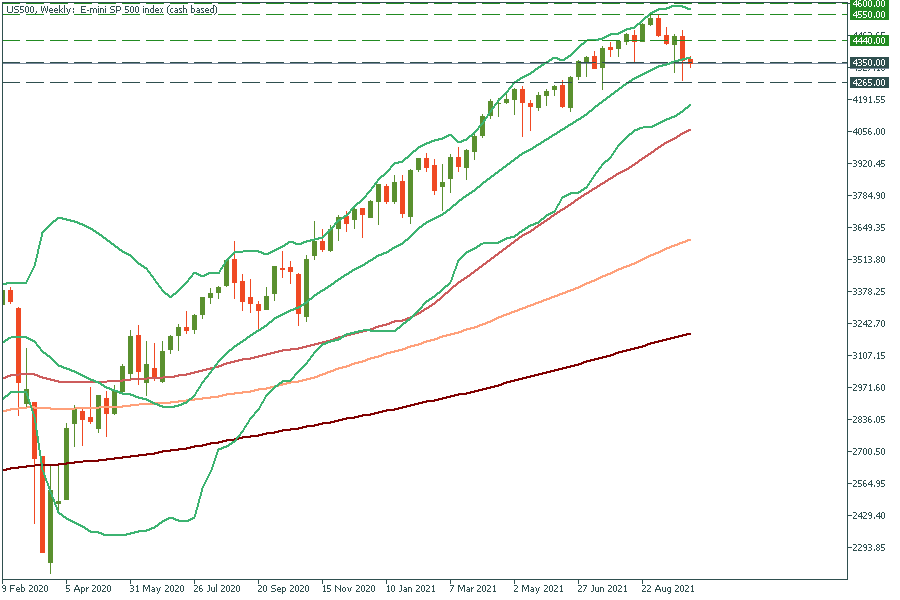
Nevertheless, we see that stock indexes are near the strong support levels. JP 224 has touched the 50-week moving average at 28,200, S&P 500 (US 500) has been moving sideways around the 100-day moving average at 4350, while Hong Kong’s HK 50 has hit the one-year low. Will they reverse up soon?
If we open the weekly chart of the S&P 500, we will notice that the stock index has failed to break the midline of Bollinger Bands many times since the Covid-19 outbreak in February-March 2020. Thus, there are more chances that the stock index will reverse up soon and return to the recent highs. For now, we should monitor the price movement and wait for the bullish signals. One of the indicators which can help to find the perfect moment to enter can be MACD. If the MACD indicator surges above the signal line, it can signal the reverse up. Read more about MACD in our article.
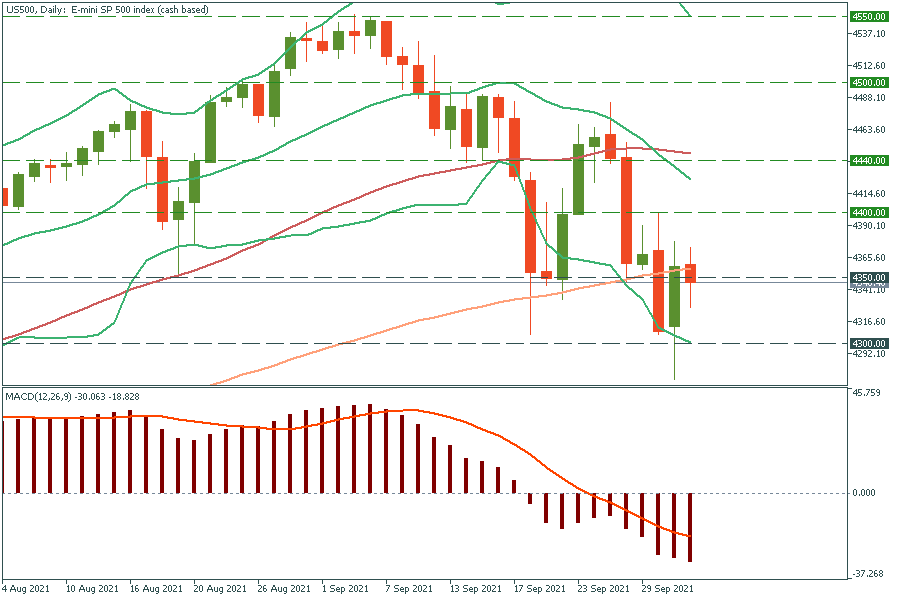
Let’s look at the daily chart of the S&P 500. We can notice a strong resistance level at 4400. If the stock index beaks it, the index may jump to the 50-day moving average of 4440. After breaking through the 50-day MA, the stock index is likely to keep rising to the previous highs of 4600. Support levels are 4350 and 4300.
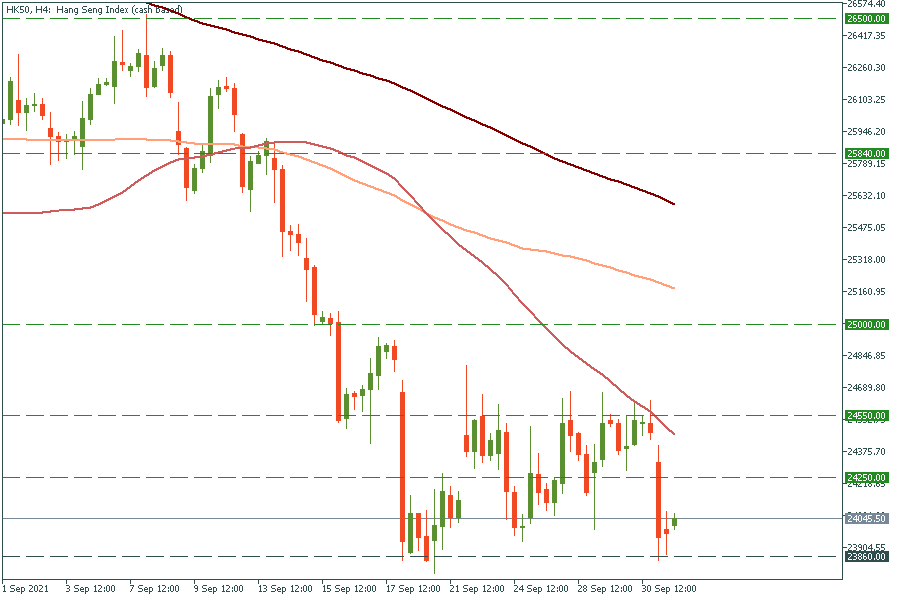
HK 50 is stuck between 23,860 and 24,550. Since the index has touched the bottom of this channel, it’s likely to jump from it. The first resistance level is 24,250. If HK 50 breaks above it, the index may rally up to the 50-period MA at 24,550.