Trading Accounts
Trading Conditions
Financials
CFD Trading instruments

Don’t waste your time – keep track of how NFP affects the US dollar!
The ASIC policy prohibits us from providing services to clients in your region. Are you already registered with FBS and want to continue working in your Personal area?
Personal areaInvestors in popular FAANG stocks have enjoyed a great run over the last year as a combination of super-low interest rates from the Federal Reserve and high growth from the individual tech companies has made an easy bull case.
However, the Fed has changed its manner of speaking and the market awaits stimulus tapering. This decision will push up rates from the bottom and the FAANG stock prices could be nearing a pullback.
Another reason for this pullback is that FAANG companies (Facebook, Amazon, Apple, Netflix, Google) and Microsoft are the prime beneficiaries of the work from the home phenomenon. Experts think that declining earnings will be a bigger problem than the change of a key rate.
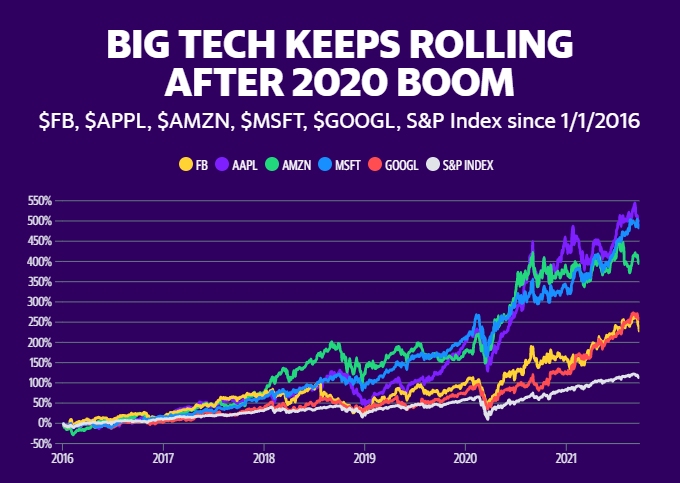
As we can see on the chart, the top 5 biggest companies in S&P500 have been carrying the index during the pandemic. It means that many other companies have underperformed for the past 2 years. Based on these facts, we suppose that when the labor market recovers and people return to the offices, we will see a money transfer from FAANG and Microsoft to the real sector (cruises, airplanes, etc.).
Apple, weekly chart
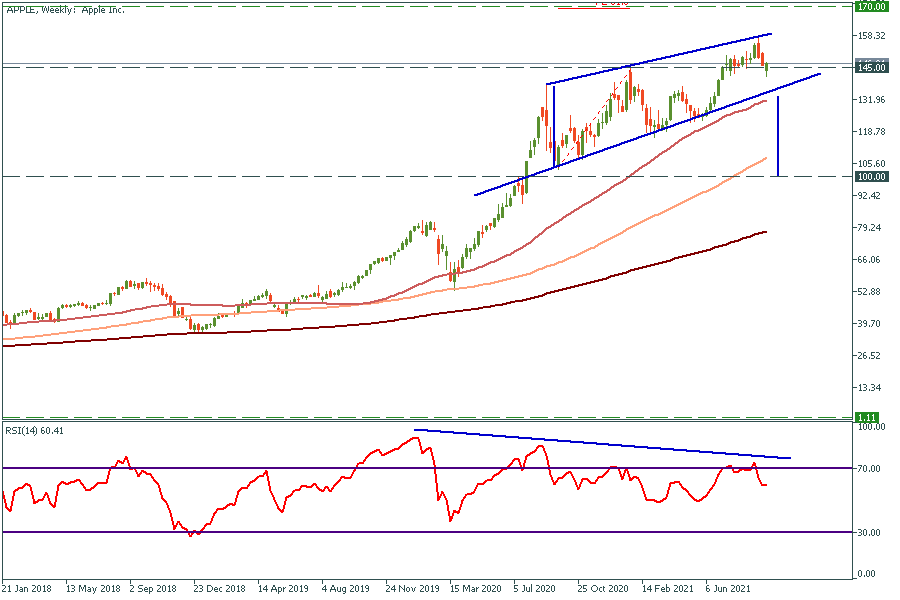
Apple stock price is trading in the rising channel with the RSI divergence on the weekly chart. As soon as the price breaks through the bottom line of the channel, the target of $100 will be set. On the other hand, if buyers get greedy and break the upper line of the channel, Apple stock will skyrocket to $170.
Facebook, weekly chart
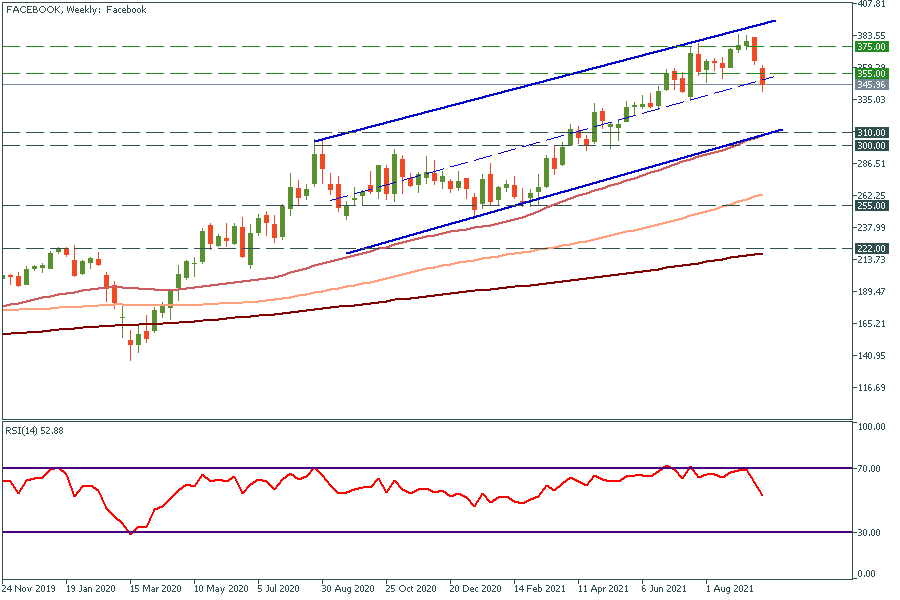
Facebook is also moving in the rising channel. It looks like October will be not the greatest month for this stock if the price doesn’t rise above $360 by the end of September. Bears have the first target at the $300-$310 range and if this level gets broken through the price might fall as low as $255.
Amazon, weekly chart
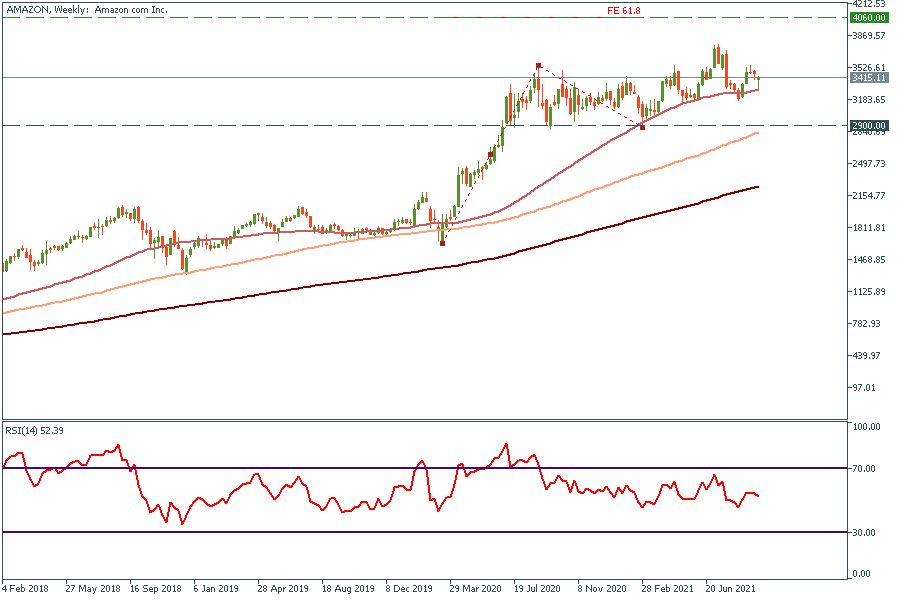
Amazon looks stronger than the other companies from the top 6. It gets held by the 50-week moving average, so we suppose that it is a great long trade entry point with the target at $4060. On the other hand, if the price closes below this support line it might fall to $2900.
Netflix, daily chart
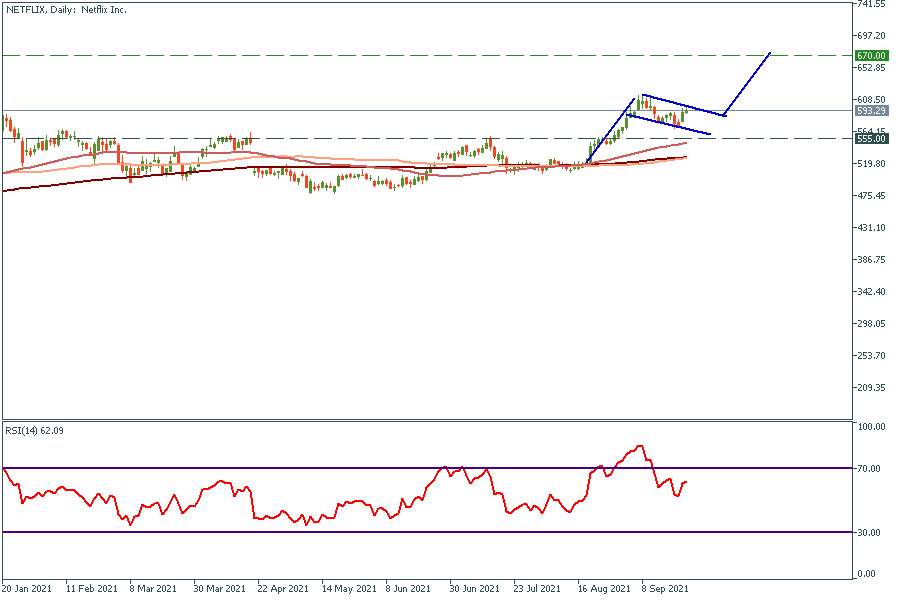
After a long consolidation, Netflix finally demonstrated 10% growth. At the moment the price is trading in the bullish flag. As soon as the price breaks through the upper line of the flag it will surge to the $670 target. The support level is $555.
Microsoft, daily chart
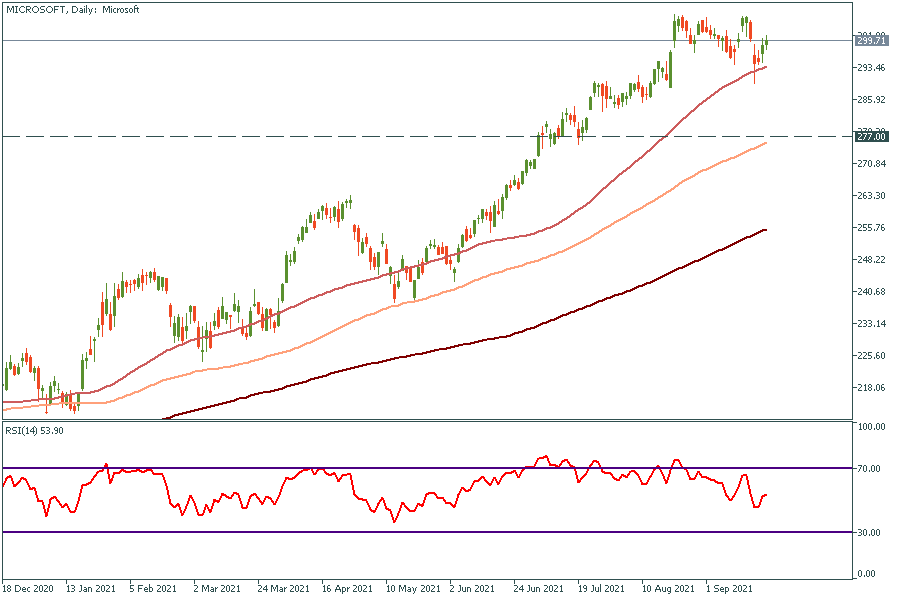
Microsoft stock growth with the RSI decrease is a bad sign. A correction is needed for future growth. As soon as the price breaks through the 50-day moving average, it will go to $277. After that, after the all-time high breakout, the target at $350 will be opened.
Google, daily chart
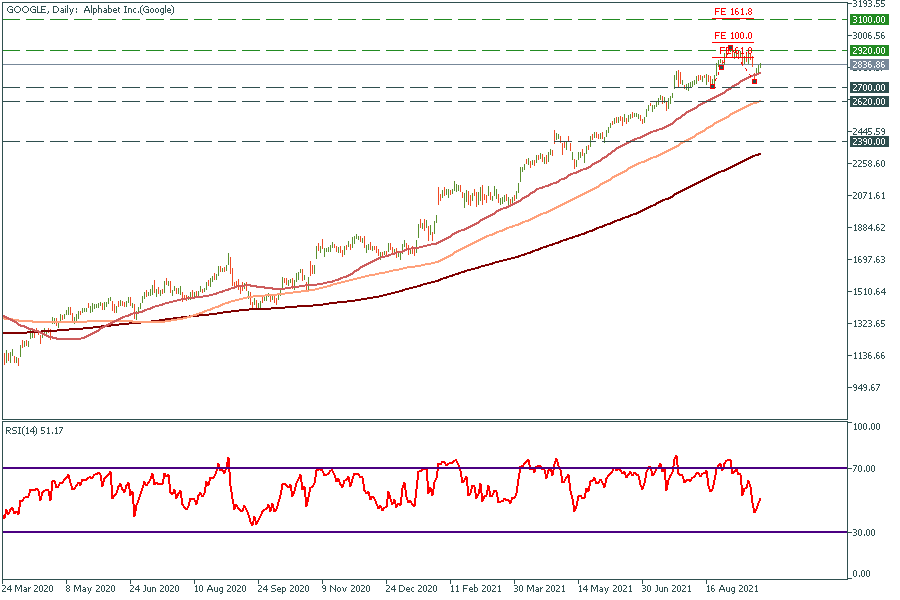
Google stock looks extremely overbought on the high timeframes. As soon as it breaks through the 50-day moving average it will drop to $2700 and $2620 support levels.
$3100 will be the target if the price breaks through the previous high of $2920.