Trading Accounts
Trading Conditions
Financials
CFD Trading instruments

Don’t waste your time – keep track of how NFP affects the US dollar!
The ASIC policy prohibits us from providing services to clients in your region. Are you already registered with FBS and want to continue working in your Personal area?
Personal areaJackson Hole Symposium, which will take part in Wyoming, will make a significant effect on the global markets.
During the past week, coronavirus concerns eased as China succeed in fighting coronavirus and many vaccine producers reported positive results for the latest tests. Oil gains as community await global economy recovery and first countries (New Zealand and South Korea) began coronavirus stimulus tapering. These facts tell us that the global economy is ready to recover, and governments will start to minimize COVID-19 stimulus one by one soon.
Economic Policy Symposium, held in Jackson Hole, Wyoming, is attended by central bankers, finance ministers, academics, and financial market participants from around the world. During two upcoming days' markets, the community might get information about the US future monetary policy. According to the global trend, we might get some information about upcoming US economic stimulus tapering which will put some pressure on the global market.
In this article, we will look at the US dollar index and try to predict what global markets trend will this meeting set.
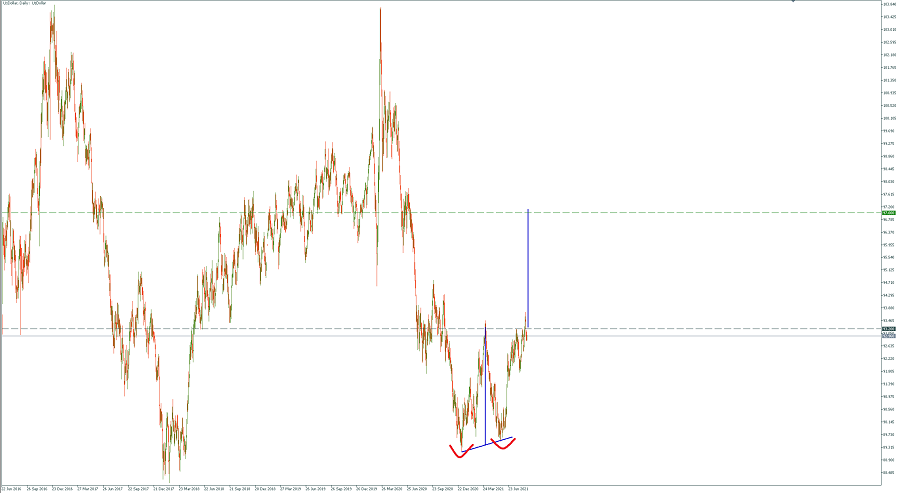
US dollar index, Daily chart

On the daily chart, a double bottom pattern occurred with the target at 97. Also, it is noticeable that 2020-2021 and the 2017-2018 price movements look similar (strong downtrend, correction around 92-93 range, another drop, consolidation, and finally uptrend).
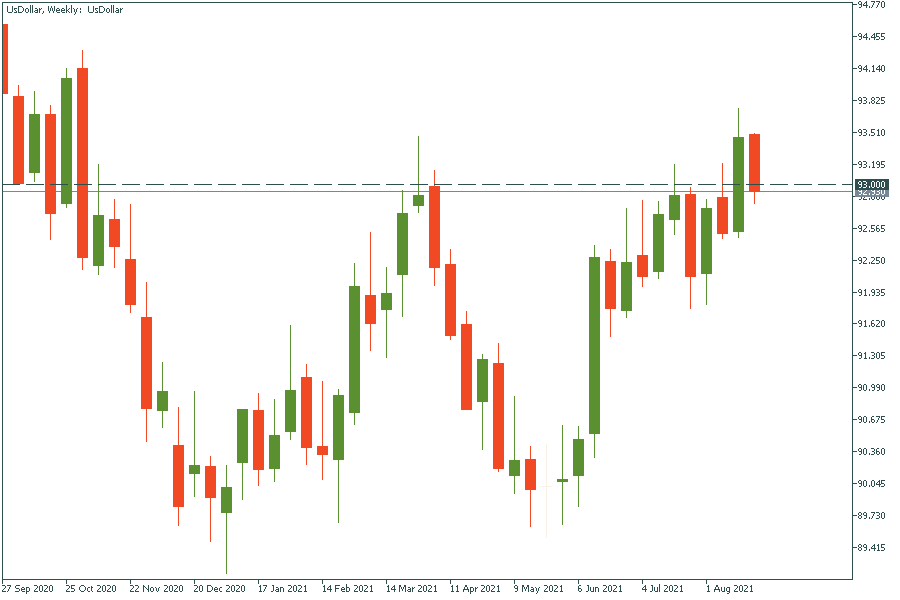
US dollar index, Weekly chart

On the weekly chart, we can see that the price stuck above 93 for the first time since the beginning of November 2020. At the moment it is testing this big resistance level from the above and if by the end of the week US dollar index will be higher than 93, the double bottom pattern will be confirmed.
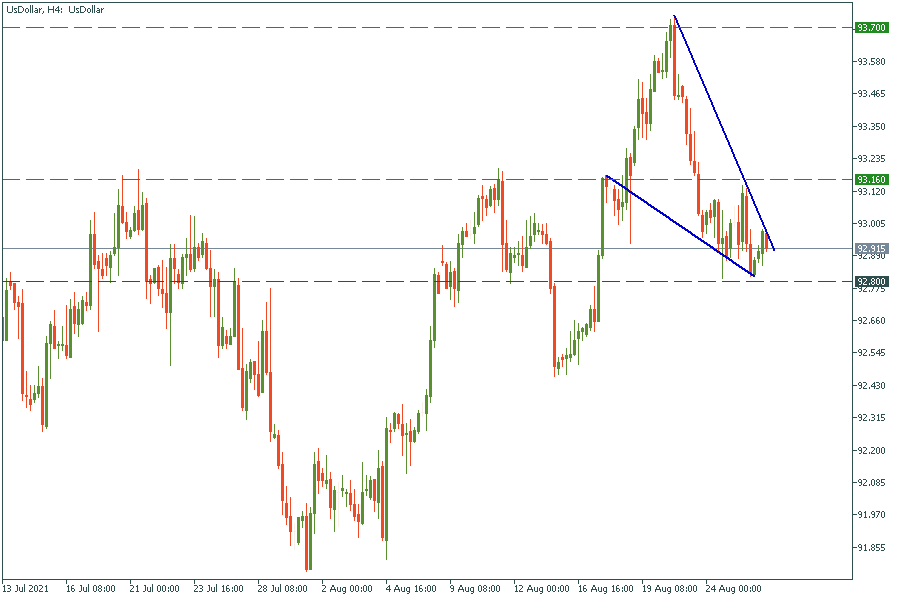
US dollar index, 4H chart

On the 4H chart, the US dollar index has formed a falling wedge pattern, which is bullish. The main support level is 92.8. If the price holds this level and breaks the falling wedge, we will get a massive pump to 93.16 and 93.7 resistance levels, which will be the start of a strong US dollar uptrend towards 97. Otherwise, the whole story might be declined, and the US dollar will get weaker during the next weeks.
The charts look interesting ahead of one of the main evens for the US economy.
There are two main conditions for the US dollar pump:
Since the US dollar index is not available to trade with FBS, you can trade major currency pairs (EUR/USD, AUD/USD, USD/CAD and etc.) according to this information.