Trading Accounts
Trading Conditions
Financials
CFD Trading instruments

Don’t waste your time – keep track of how NFP affects the US dollar!
The ASIC policy prohibits us from providing services to clients in your region. Are you already registered with FBS and want to continue working in your Personal area?
Personal areaJapanese shares fell on Monday. Investors are concerned about slow economic growth due to the highly contagious Delta variant of COVID-19. The Nikkei (JP225) closed 1.6% lower at 27.500. It is the biggest drop since July 30. These factors led to the yen strengthening as the Japanese national currency usually demonstrates an inverse correlation with the stock market.
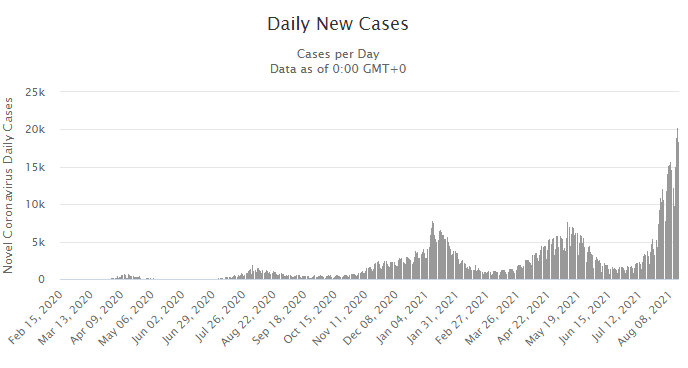
Japan is still far behind the US and Europe in taking measures against COVID-19. Analysts and experts warn that it can potentially lead to an economic growth slowdown. Tokyo is already under a state of emergency, the fourth so far in the pandemic, though some experts believe it should be expanded to cover the whole country as the number of new infections remains at a record level. The number of daily cases hit 20.000.
Afghan government’s collapse also shocked Asian stock markets as it can impact negatively in long term-period. Some experts claim the market will try not to pay attention to this geopolitical situation, while others believe that the worst awaits ahead.
Let’s look at the charts and find out how Japan’s stock market will behave in the nearest future and how it will affect the national currency.
JP225, weekly chart
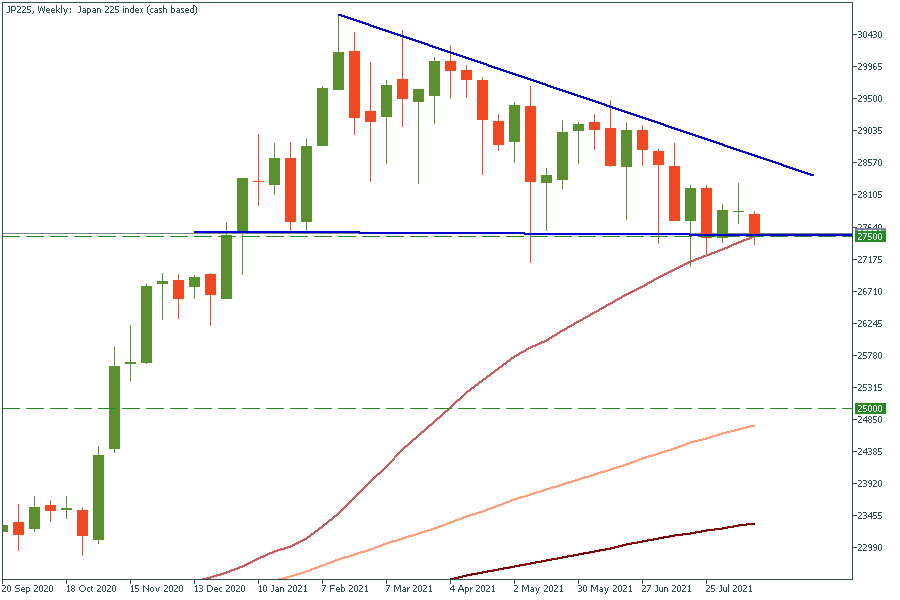
On the weekly chart, the price has formed a descending triangle, which is a bearish pattern with the target at 25.000. If the price breaks and sticks under the support line (which is 27.500), it will go down to 25.000.
JP225, daily chart
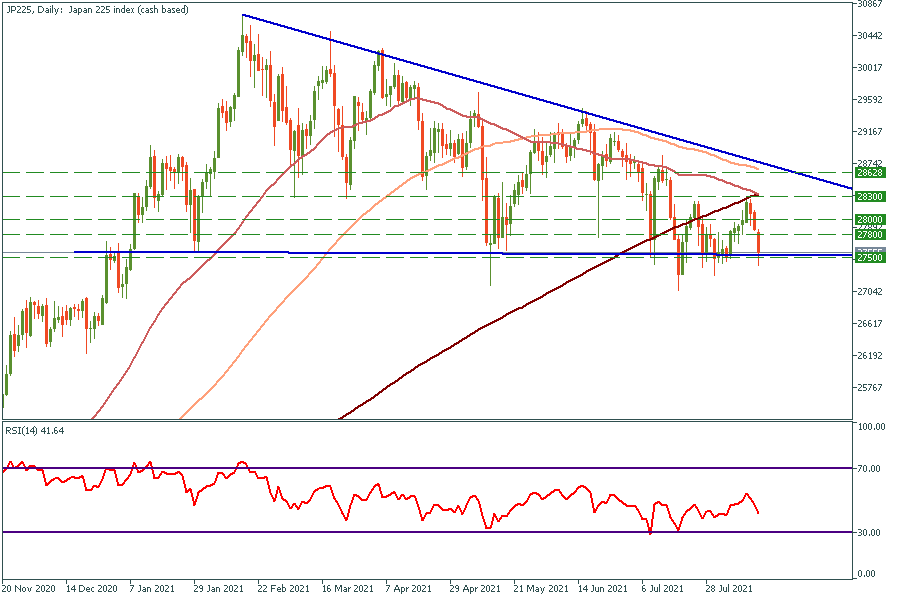
On the other hand, locally, it is noticeable that during the past month price and RSI minimums have been getting higher. It means that in the short-term Japanese stock market is attractive for investors. For now, it is a good opportunity for a long trade with an entry point at the 27.500-27.600 range. In this case, the targets will be 27.800 (the 100-period moving average), 28.000 (the 200-period moving average), 28.300 (the 200-day moving average).
EUR/JPY, Weekly chart
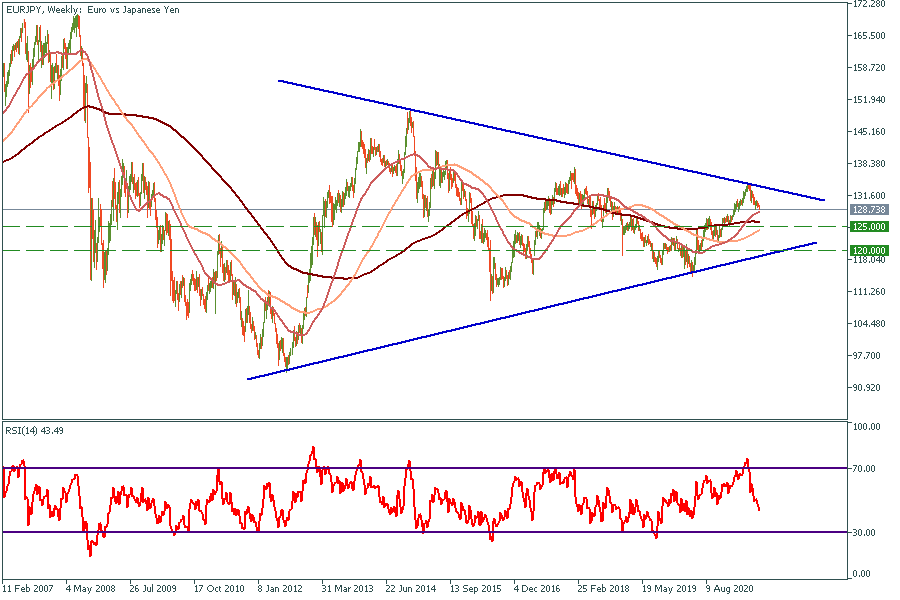
On the weekly chart, the price has formed a symmetrical triangle. According to our suggestion about the Japanese stock market's weak future and its inverse correlation with the national currency strength, we assume that EUR/JPY might head at least towards the triangle’s median, which is 125. In this case, every pullback might be a good chance to find an entry point for EUR/JPY short trade.
EUR/JPY, 4H chart
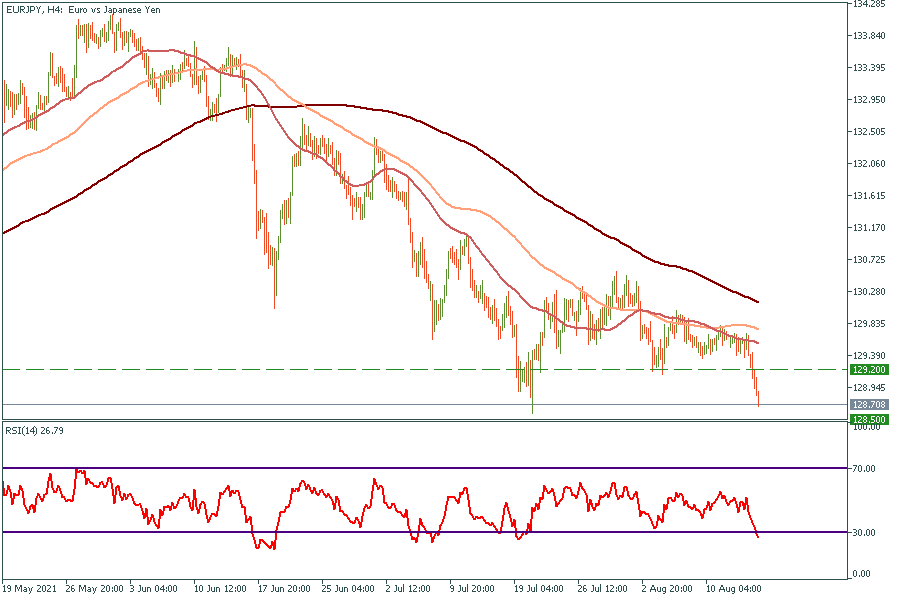
Locally, it came to the strong support level at 128,5. According to the RSI, the currency pair is oversold, that’s why we expect a pullback to the 129,2-129,5 range.