Trading Accounts
Trading Conditions
Financials
CFD Trading instruments

Don’t waste your time – keep track of how NFP affects the US dollar!
The ASIC policy prohibits us from providing services to clients in your region. Are you already registered with FBS and want to continue working in your Personal area?
Personal areaIn this article, we will discuss US100, US500, HK50.
China's coronavirus cases have hit a seven-month high after a cluster at a testing site drove up case numbers as the Delta variant challenges the nation's grip on the pandemic.
Only Chinese vaccines are currently being given in China, and authorities say more than 1.6 billion doses have been administered. However, experts are concerned that these vaccines are not effective. Current outbreaks across China, while still in the hundreds of cases in total, have spread much more widely than previous ones. Many cases have been identified as the highly contagious Delta variant.
COVID-19 problem coupled with a regulatory crackdown on sectors including technology and after-school tutoring dumped investors’ sentiment towards Chinese stocks. That’s why HK50 is getting pressured.
H4 HK50 chart
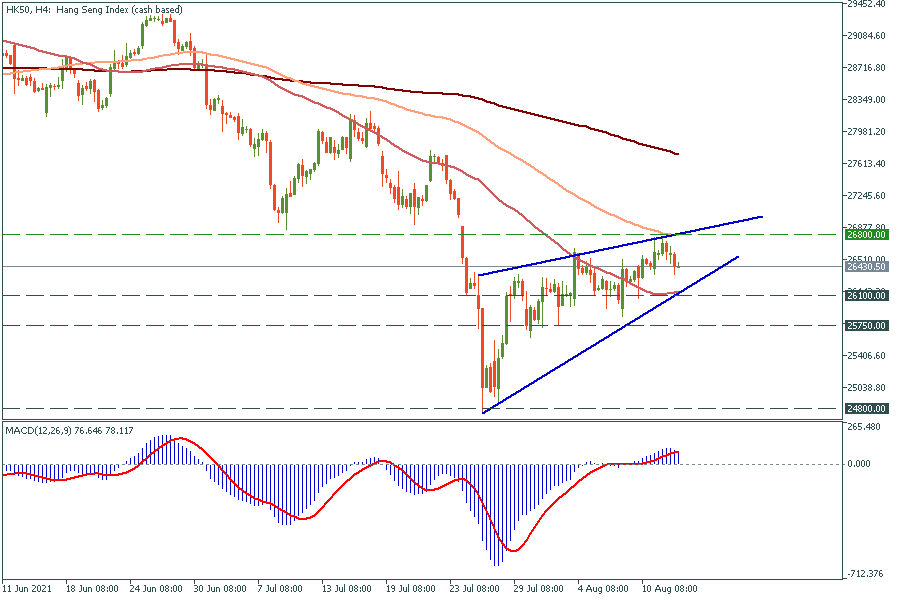
On the 4 hours chart, the HK 50 has formed the rising wedge, which is the bearish pattern. At the moment, HK50 is heading towards the 50-period moving average, which is also the bottom line of the wedge. If the index breaks through this support, it might drop down to 25750 and 24800 support levels. Otherwise, it might test the top line of the pattern at 26800 once again.
NASDAQ (US100)
During recent months, US100 has been demonstrating a correlation with the US dollar index. This is happening as investors believe that the US dollar weakening might force the government to raise the interest rate. When it happens, investors prefer to get rid of risky assets.
Also, many countries have already removed COVID-19 restrictions and people spend less time using their computers. This will negatively affect US100, as it consists of the 100 largest IT companies.
US100 Daily chart
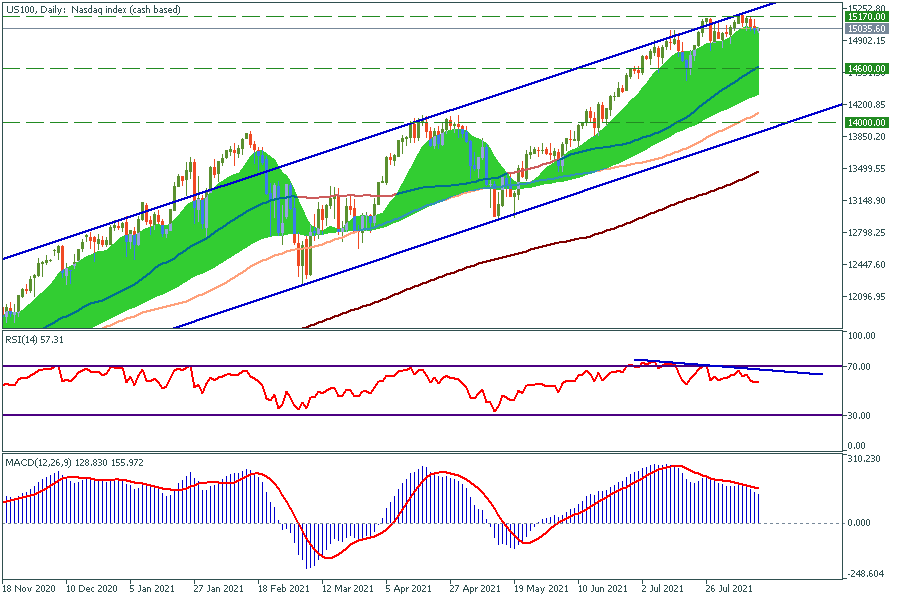
On the daily chart, it is noticeable that US100 is moving inside the rising channel. At the moment, we can see bearish divergence with the RSI. The MACD oscillator also shows that the trend is getting weaker. MA Ribbon indicates that the trend gained maximum momentum and as it is seen on the chart, it is a signal for upcoming correction. We expect US100 to fall to 14000 to the bottom line of the channel.
S&P 500 (US500)
US 500 index consists of 500 largest US companies. Investors took into account a report pointing to contained inflationary pressures and considered the likelihood of more government spending on infrastructure. That pushes the main US economy index to new heights.
US500 Daily Chart
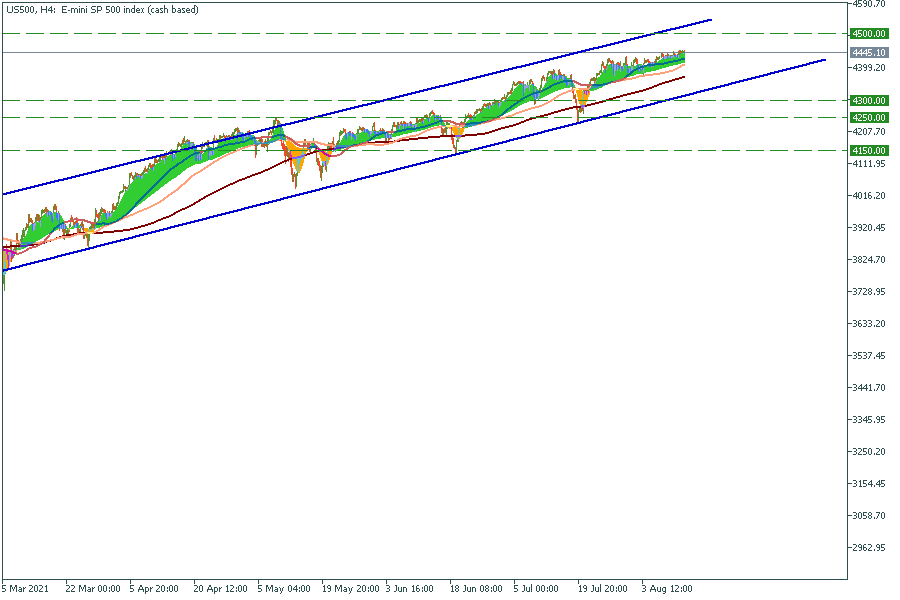
Despite positive factors for the US economy, the US 500 index cannot reach the upper border of the channel. It means the trend is getting weaker. MA Ribbon indicator also shows that the momentum decreases since May 2021. If US500 breaks through the 100-period moving average, it will drop to the lower border of the channel, which is 4300. We suggest opening S&P500 as soon as it reaches either border of the channel.
Resistance levels: 4500
Support levels: 4300, 4250, 4150