Trading Accounts
Trading Conditions
Financials
CFD Trading instruments

Don’t waste your time – keep track of how NFP affects the US dollar!
The ASIC policy prohibits us from providing services to clients in your region. Are you already registered with FBS and want to continue working in your Personal area?
Personal areaCorrelation is a statistical measure that determines how assets move in relation to each other. It can be used for individual securities, like stocks, or general market correlation, like asset classes or broad markets.
Correlation is measured on a scale of -1 to +1. +1 meaning is a perfect positive correlation, and -1 is a perfect negative correlation.
A positive correlation means that assets move in the same direction. A negative correlation vice versa means that assets move in opposite directions.
Correlation is often used in portfolio management to measure the amount of diversification among the assets. But today, we will discuss how to include correlation into your trading strategy.
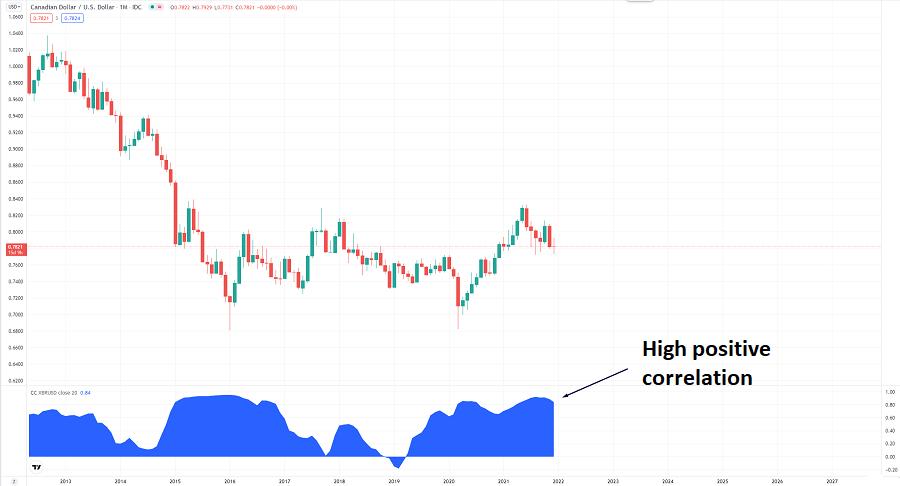
Oil prices affect the value of currencies in producing countries.
For example, Canada, one of the largest economies in the world, has substantial oil reserves. Moreover, it exports most of its oil to the United States.
The Canadian oil industry is so vast that it affects GDP (Gross Domestic Product), politics, and all of Canada’s wealth. In addition, a significant part of the population is employed in both mining and refining enterprises, so the economic power depends on the oil industry.
The central pair for CAD in Forex is USD/CAD. Consequently, the direct correlation between oil and the Canadian dollar has the opposite effect on the USD/CAD pair. Therefore, higher oil prices lead to a decrease in USD/CAD. A decline in oil prices leads to an increase in USD/CAD.
Let’s look at some other widespread correlations between commodities and currency pairs.
Gold up, USD down. Economic crises make investors convert their dollars into gold.
Gold up, AUD/USD up. Australia is the third-largest gold supplier in the world, so the Australian dollar is connected with the gold demand.
Gold up, NZD/USD up. New Zealand also produces a lot of gold.
Gold up, USD/CAD down. Canada is the 5th largest gold supplier in the world. Therefore, USD/CAD moves down if gold prices go up.
Gold is up, EUR/USD is up. Gold and the euro are considered anti dollars. Therefore, an increase in the price of gold often leads to a rise in the EUR/USD rate.
Oil is up, USD/RUB is down. Russia is one of the largest oil producers in the world. If oil becomes more expensive, the pair goes down.
There are two main types of assets – risk assets and safe-havens. Investors choose the type according to the global economic situation. If it is unstable, they prefer to hedge their capital in USD, JPY, or metals.
On the other hand, investors prefer to transfer their capital into high-risk assets such as stocks or crypto if the global economy grows. For that reason, risk assets have a high correlation with each other, which you can use in your trading strategy.
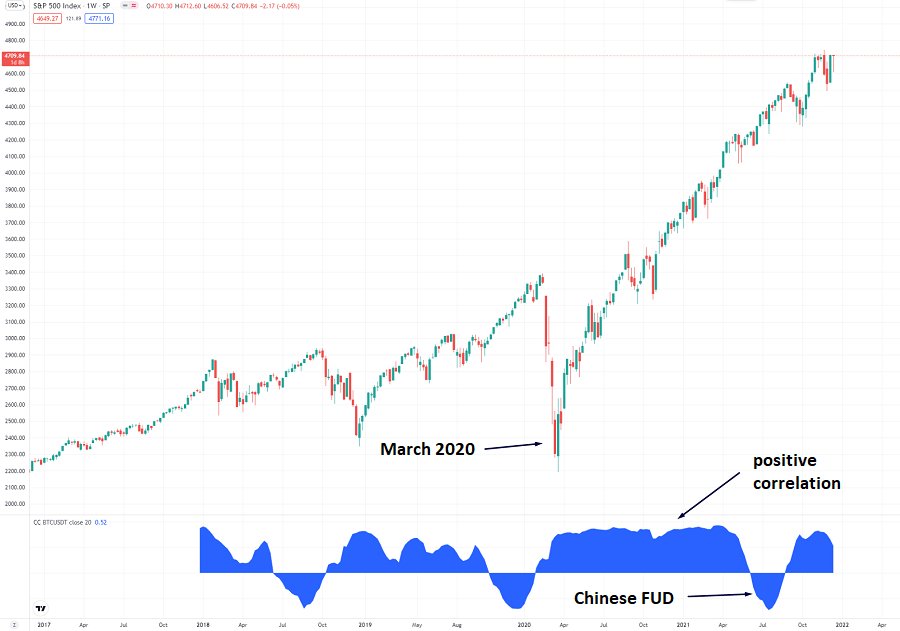
For example, the S&P500 (US500) index strongly correlates with Bitcoin. The only time the correlation between these two assets dropped below zero was after China prohibited trading and mining cryptocurrencies. Traders can use this feature to predict US500 next move by looking at the Bitcoin chart and vice versa.
US500 and Bitcoin correlation
If one country's stock market performs better than the market of another country, capital from the first country will flow to the second one. This fact will immediately affect both national currencies. The inflow of investments strengthens the foreign exchange.
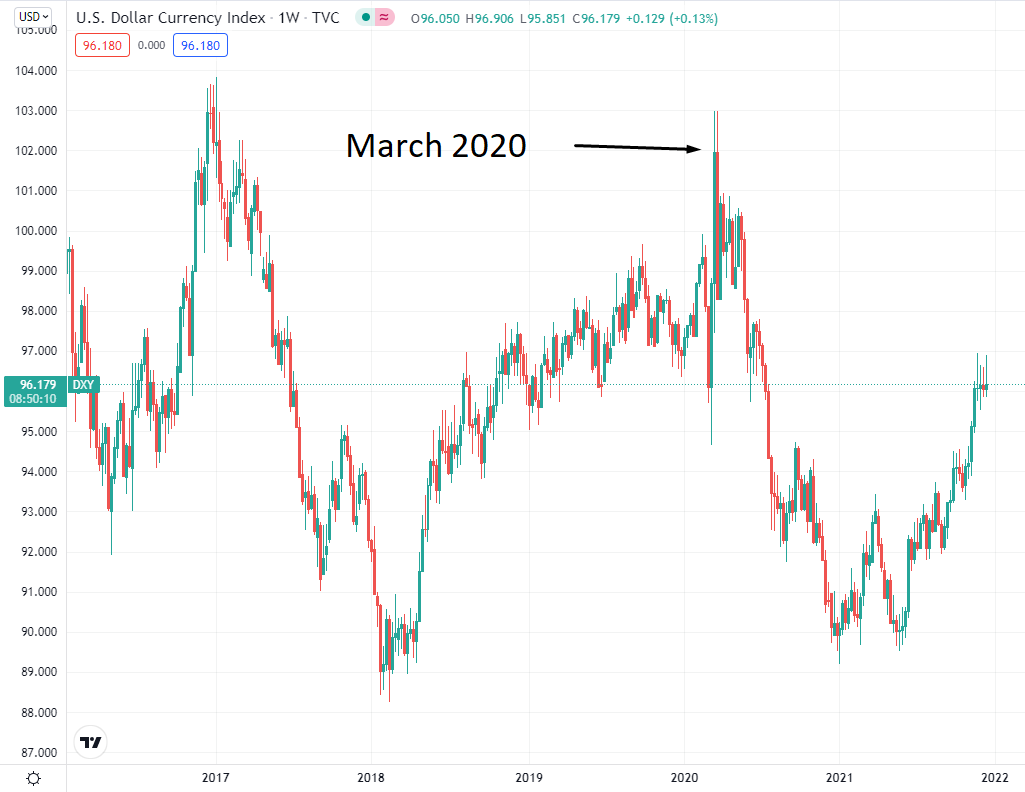
However, there are two exceptions: the US and Japanese stock markets. Investors usually consider USD and JPY as save haven assets and invest in them during unstable situations on the world market. Therefore, during periods of economic stability, investors prefer to sell their USD and JPY and transfer their capital into high-risk assets. On the other hand, everybody gets rid of risk assets and returns into safe haven during periods of growing concerns or after ‘The Black Swan’ appearance.
As an example, let’s look at the March 2020 drop. As you can see, when the US500 index dropped, the US dollar index has reached the highest point since 2018. It happened because investors transferred all their money from stocks and cryptos into the US dollar.