Trading Accounts
Trading Conditions
Financials
CFD Trading instruments

Don’t waste your time – keep track of how NFP affects the US dollar!
The ASIC policy prohibits us from providing services to clients in your region. Are you already registered with FBS and want to continue working in your Personal area?
Personal areaMAs often serve as important support and resistance markers. How should traders use that? Let's see it in a couple of brief examples below.
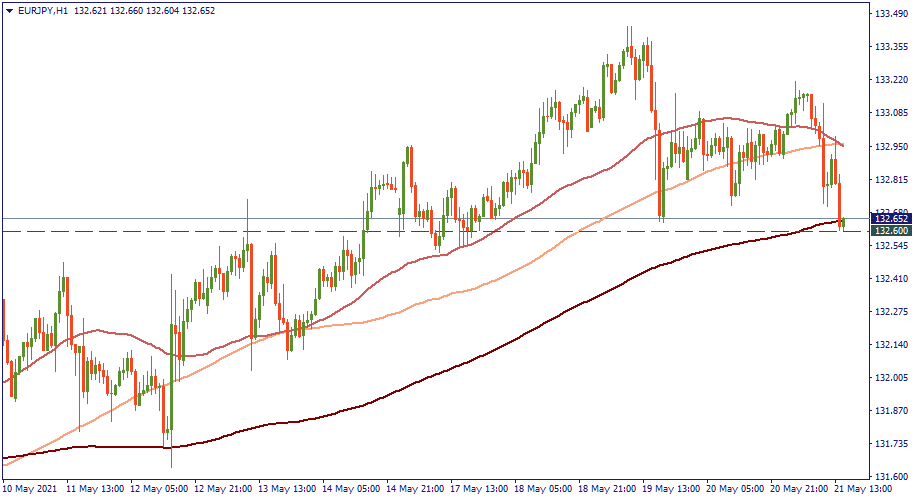
In the H1 chart below, 200-MA serves as a support area for EUR/JPY which is testing it at 132.60. As you can see, the support at this level was formed by the previous lows on May 17 and 19, but now, it is reinforced by the presence of the 200-MA. How to trade that?
Primarily, 200-MA is an important psychological level here. Even without the corresponding previous lows on the chart, the 200-MA alone would be an important challenge for bears. Also, the 200-MA is a long-term MA, and normally, the more long-term the MAs, the more is its "power".
Therefore, first, traders should prepare for a likely scenario in which the 200-MA sends the price back into the upside. On the other hand, given the importance of the support of the 200-MA at 132.60, it's like a last stand of the well-guarded downside. If the 200-MA is crossed downwards, bears will then have the entire space below to drag the price pretty much where they please. In our case, it would be 132.00.
If MA is decisively crossed, the trend that pushed through may gain more power.
Careful with false breakouts - wait for the price to confirm the breakthrough!
Second most commond case is when an MA send the price into an opposite direction it was going in before. In other words, the price bounces from an MA.
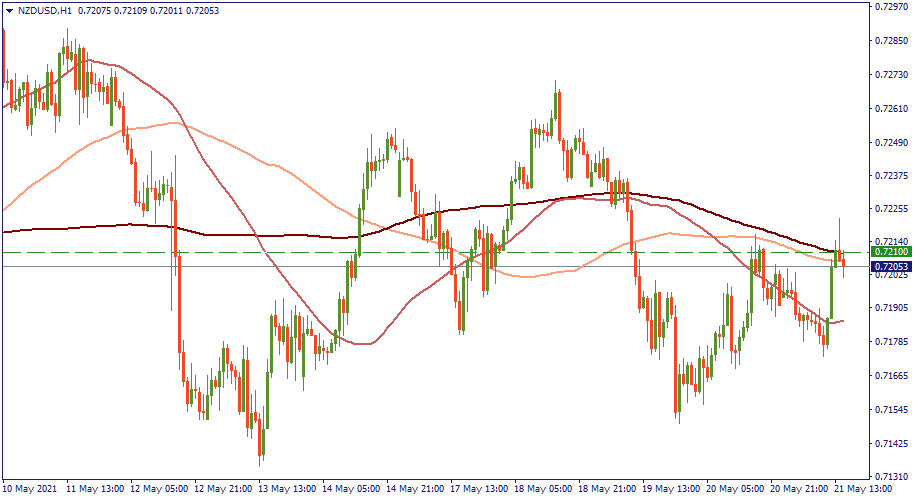
On the H1 chart below, NZD/USD is on the rise. As you can see, it's challenging the resistance of the 200-MA and 100-MA at 0.7210 as it already crossed an important psychological resistnace of 0.72. Very likely, we are observing a peak of an upswing and a start of a new downtrend formation.
Therefore, if you spot reversal candlestick formations on other timeframes as well - the MAs are sending the price back downwards.