Trading Accounts
Trading Conditions
Financials
CFD Trading instruments

Don’t waste your time – keep track of how NFP affects the US dollar!
The ASIC policy prohibits us from providing services to clients in your region. Are you already registered with FBS and want to continue working in your Personal area?
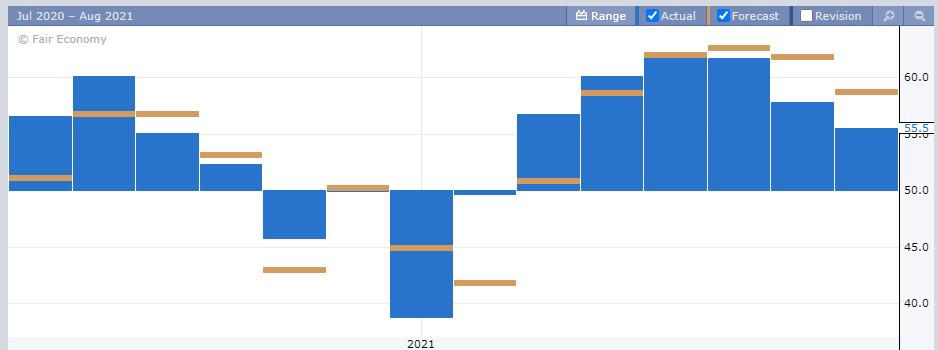
Personal areaUK private sector companies experienced a sharp slowdown in output growth during August, according to the latest PMI data. Flash Manufacturing PMI performed better with 60.1 actual vs. 59.5 expected. Flash Services PMI report showed worse than expected results of 55.5 against the market's expectation for 59.0. This marks a slowdown on July's reading of 59.6. Although the latest reading was still above the crucial 50.0 level, it was the slowest expansion of output since March 2020. Because of shortages of staff and materials, output reduction was 14 times higher than usual and the largest since the survey began in January 1998.
Although the PMI indicates that the economy continues to expand at a pace slightly above the pre-pandemic average, there are clear signs of the recovery losing momentum in the third quarter after a buoyant second quarter. Rising virus case numbers are deterring many forms of spending, notably by consumers, and have grown via worsening staff and supply shortages. Therefore, prices have risen sharply again. Flash services PMI didn’t hit the expected level for the fourth time in a row, moving closer to the vital 50.0 level.

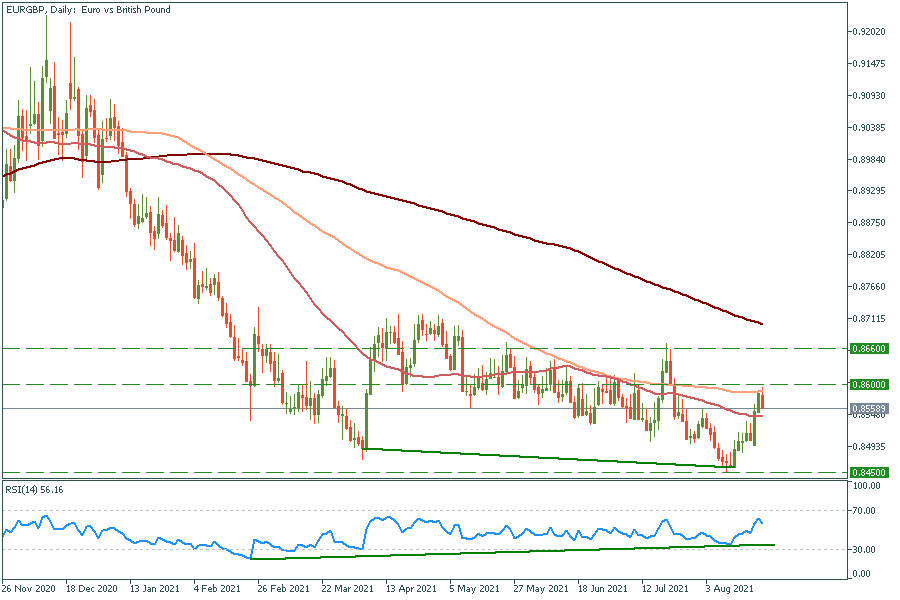
The declines in Sterling coincided with a broader sell-off in global equity markets, a deterioration that confirms EUR/GBP to be highly correlated with broader global trends. MUFG Strategist Derek Halpenny assumes that “The reason for the reversal of the EUR/GBP move lower is the increased risk-off trading conditions as COVID concerns globally increase”. However, amid weak PMI data in the UK and relatively stronger EU data, as well as rising inflation forecasts from the Bank of England (returning to 2.0% over the medium-term) and technical overview suggest that the bearish market for the euro might be over. Bullish divergence in RSI and macroeconomic conditions allude to reversal.
EUR/GBP daily chart.
Support: 0.845
Resistance: 0.86 and 0.866

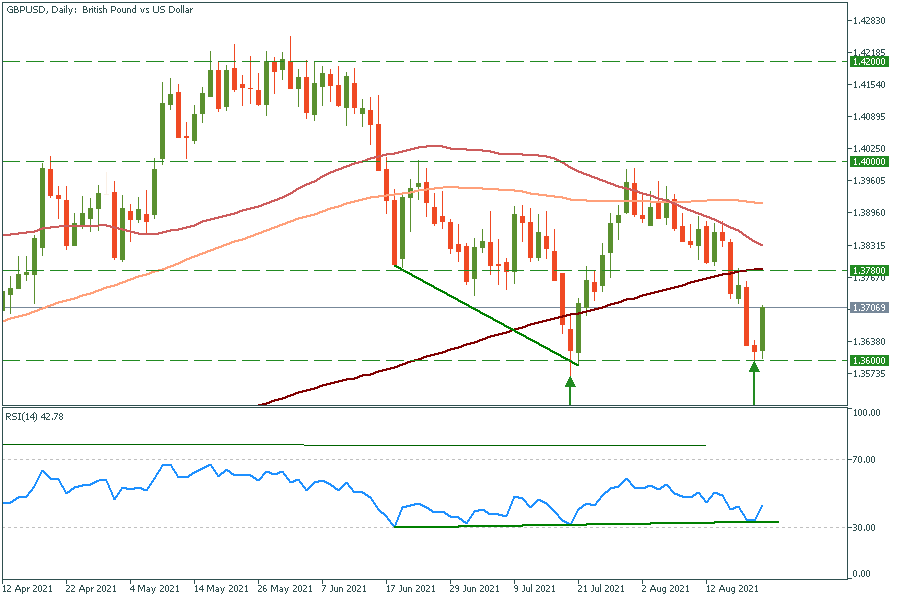
The British pound had 4 out of 5 red days last week. The dollar surged amid rate hike news. However, tapering is yet to come and now overbought greenback with weak PMI data might cede for the GBP. A potential market-positive shift (for the USD) could be triggered where the Fed signals a delay to the tapering in light of rising covid cases in the U.S. and globally.
Double bullish divergence has formed and a couple of rebounds from the support line is present. All this might signal a bullish movement for the pound sterling.
GBP/USD daily chart.
Support: 1.360
Resistance: 1.370, 1.400, and 1.420
