Trading Accounts
Trading Conditions
Financials
CFD Trading instruments

Don’t waste your time – keep track of how NFP affects the US dollar!
The ASIC policy prohibits us from providing services to clients in your region. Are you already registered with FBS and want to continue working in your Personal area?
Personal areaIn December 2021, the main question on global markets was: “When will the FED increase the key rate?” Traders and investors were transferring their capitals into USDs, waiting for the great dump worldwide. Today, many of the “growth stocks” lost more than 50% from their highs. Since November, Bitcoin has plunged by 40%. The US indices are once again trading around the bottom border of the rising global channel.
Will this bearish trend continue, or have we already found the bottom for the next couple of months?
We believe that market members have overestimated tapering risks, and right now is the perfect moment to look for long traders in risk assets.
For example, according to the Fear & Greed index, Bitcoin has already found its global support. If you look at the picture below, you will realize Bitcoin reverses every time the crypto market’s F&G index hits 10.
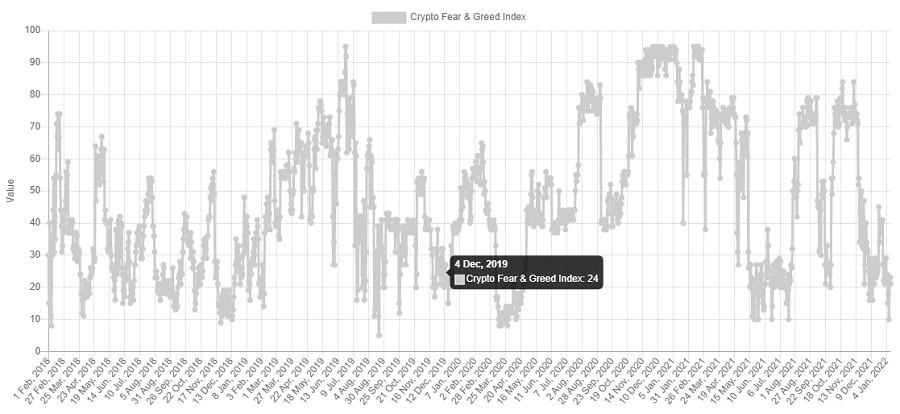
The Crypto market’s Fear & Greed index
Technical analysis
BTC/USD daily chart
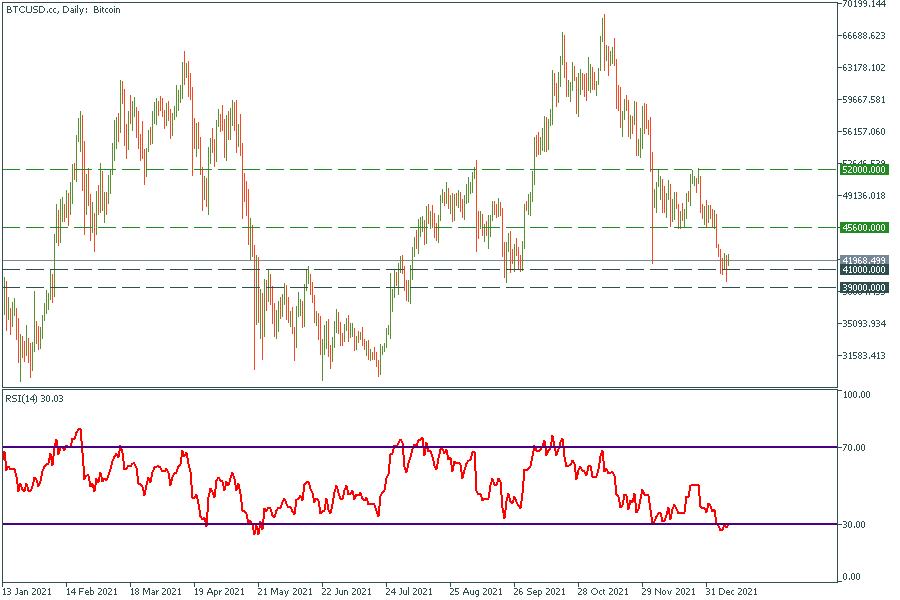
The price has reached a powerful range between $39 000 and $41 000. We can notice that the price has always reacted to these levels, so there is no doubt that the pullback will happen this time. The target for this movement is $45 600. Unfortunately, if bears can drag Bitcoin under $39000, the price will head towards $30 000.
US500 daily chart
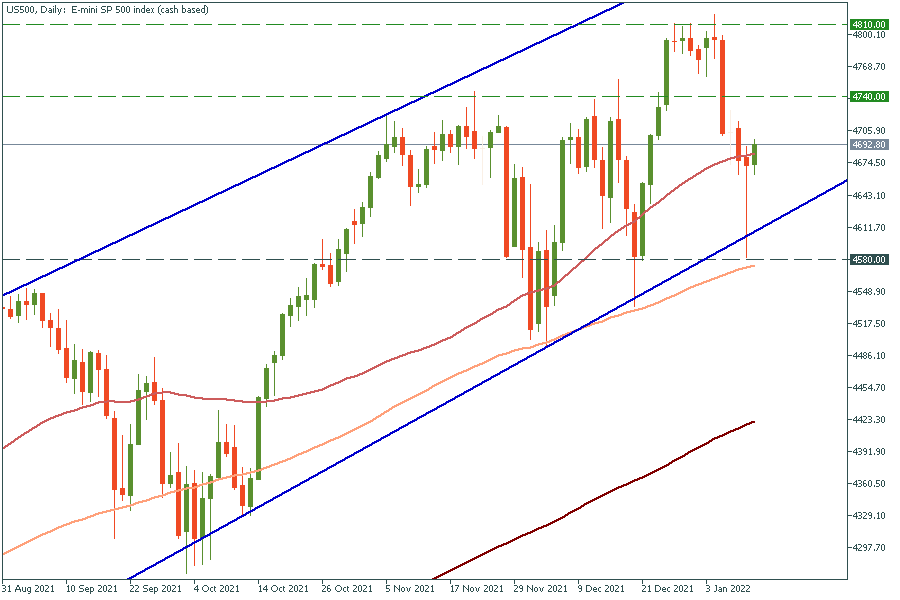
The US500 bounced off the bottom line of the global ascending channel again. The 100-day moving average is still an insurmountable barrier for sellers. We expect the US500 to renew its all-time high by mid-February. As soon as the price breaks through 4810, it will head towards 4870.
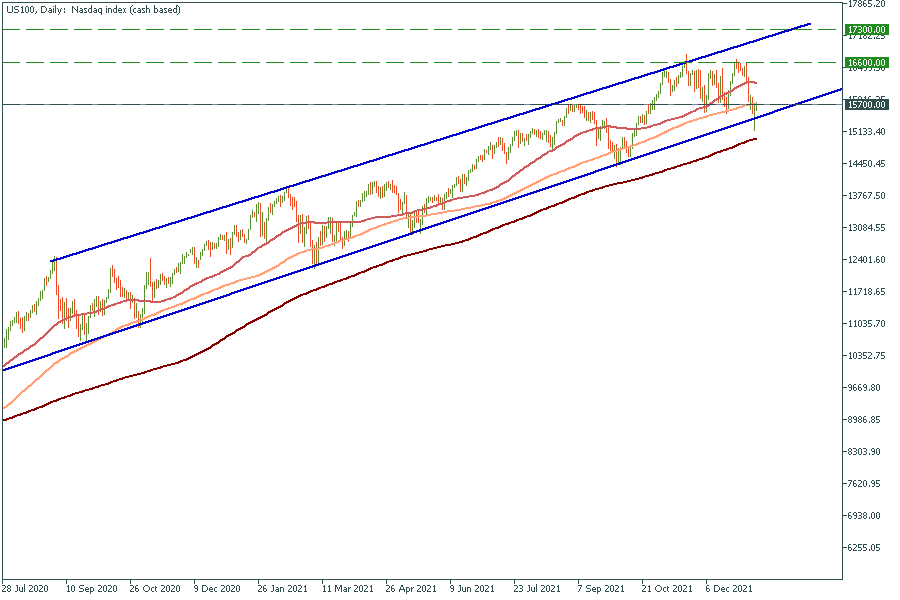
The US100 index has also bounced off the global trend line. The triple bottom pattern has appeared on the chart. As soon the price breaks through 16 600, it will reach 17 300.