Trading Accounts
Trading Conditions
Financials
CFD Trading instruments

Don’t waste your time – keep track of how NFP affects the US dollar!
The ASIC policy prohibits us from providing services to clients in your region. Are you already registered with FBS and want to continue working in your Personal area?
Personal areaThe US broad-market index, S&P 500, has been pressed below the 50-day moving average for the first time since March! Why?
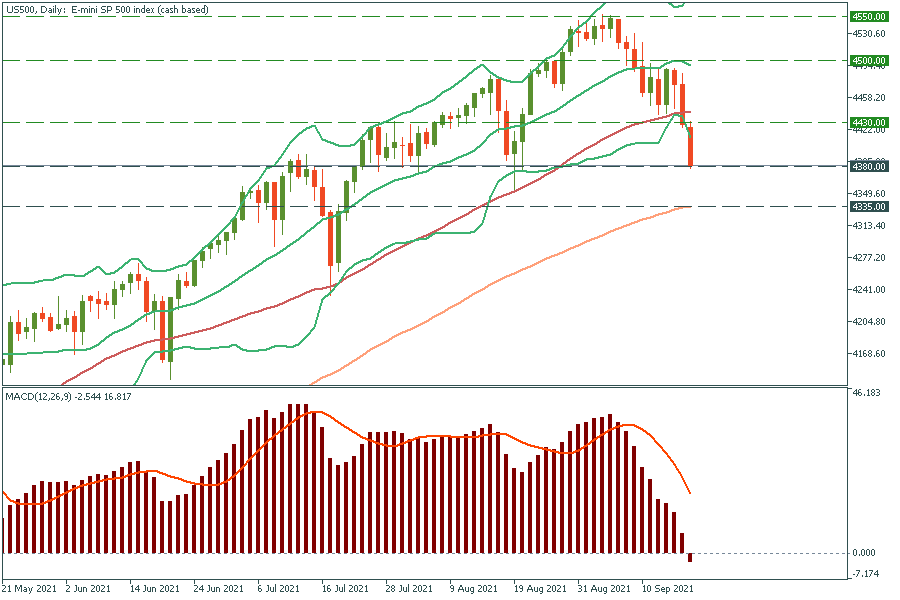
The S&P 500 index (US500) has dropped below the lower line of Bollinger Bands, which means that the price is at extreme lows and it’s going to reverse up soon. However, the correction may continue if the index breaks below the support line of 4380. The stock index may reach the 100-day moving average of 4335.
Not to miss the reversal, we highly recommend you add the MACD indicator to your chart and monitor the breakout above the zero line. When it occurs, it would signal the upcoming reversal up.
Resistance levels are the 50-day moving average of 4430 and the middle line of Bollinger Bands at 4500.
Read more on our TradingView.
