Trading Accounts
Trading Conditions
Financials
CFD Trading instruments

Don’t waste your time – keep track of how NFP affects the US dollar!
The ASIC policy prohibits us from providing services to clients in your region. Are you already registered with FBS and want to continue working in your Personal area?
Personal areaWhat is tapering?
Tapering is the reduction of the rate at which a central bank buys new assets. It is mostly used when talking about the reversal of quantitative easing (QE) policies and is regarded as the first step in winding down from a period of monetary stimulus. Tapering is just another tool used by central banks to control interest rates and the perception of future rates.
Tapering impacts interest rates almost immediately. QE policies lower the interest rate, so when the purchasing program is reduced, interest rates will rise again.
Tapering leads to deflation, pulling money out of the system and making the cost of living more affordable but increases unemployment.
Tapering often leads to fears that liquidity would decline since investors await the global market's upcoming collapse.
In the long term, banks benefit from the rate hike through the higher net interest income on loans and borrowings.
On the other hand, in short term, high inflation leads to a decrease in real incomes of the population and a decrease in demand for loans and borrowings, which is the main income for banks.
Another reason why the banking sector may suffer is a decrease in market liquidity. If people make fewer operations on financial markets, banks will get less income from their investment and brokerage directions.
JPM, daily chart
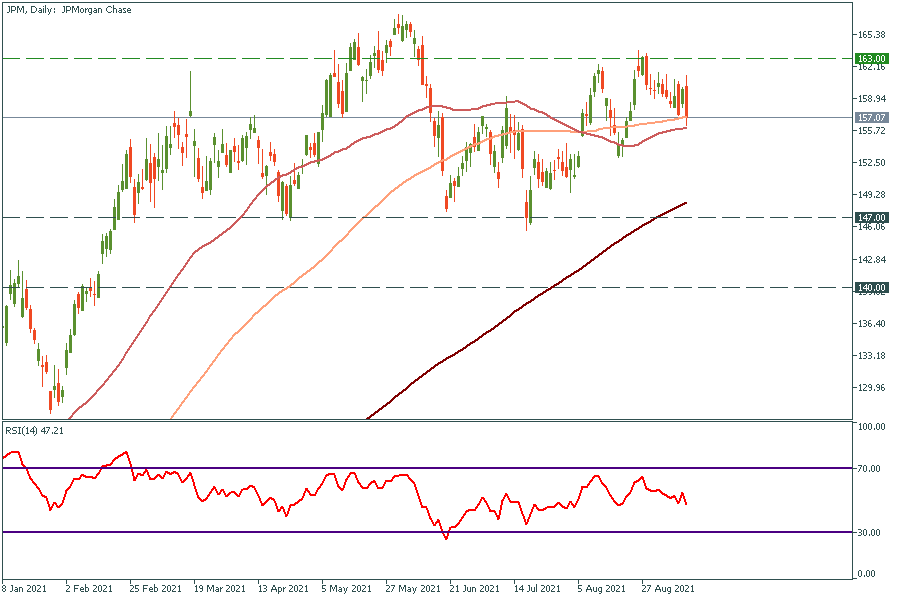
JPM dropped to its 100 daily moving average. We expect this downtrend to continue right after this support line will be broken through. Targets are $147 (the 200-day moving average) and $140 (JPM’s highest pre-pandemic price).
Citigroup, weekly chart
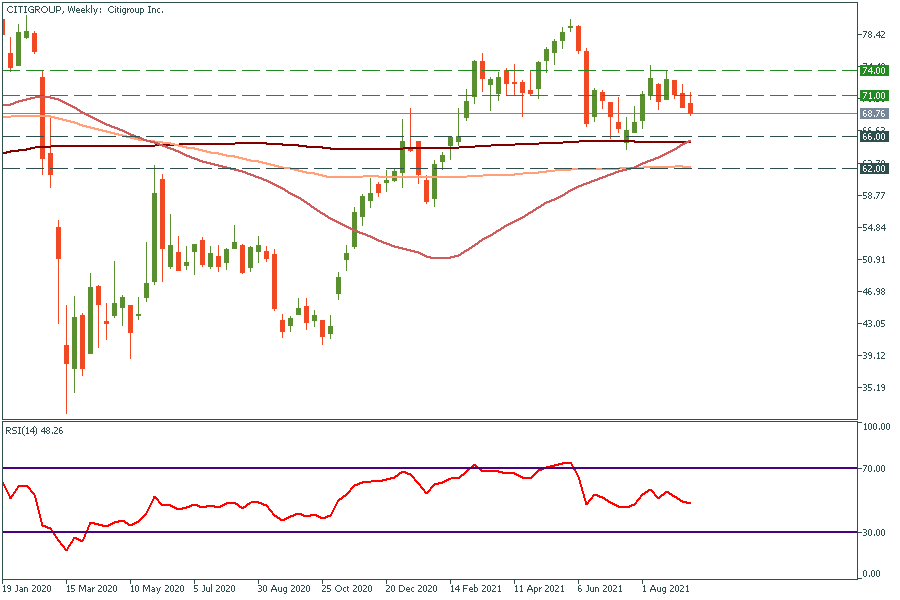
Citigroup demonstrated a worse dynamic than JP. Morgan during the period of pandemic recovery. The closest resistance level is $71, we don’t expect the price to rise higher than that level. On the contrary, we believe that in the middle term the price will reach $66 and $62, which are 200 and 100-weekly moving averages respectively.
BAC, weekly chart
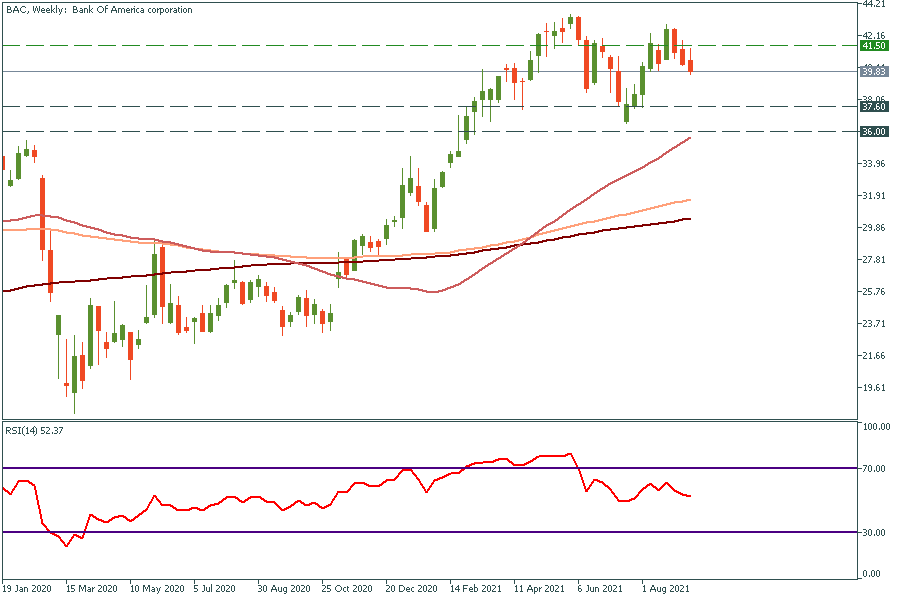
BAC’s will follow the whole sector. The price tends to reach $37.6 and $36 support levels.
GS, weekly chart
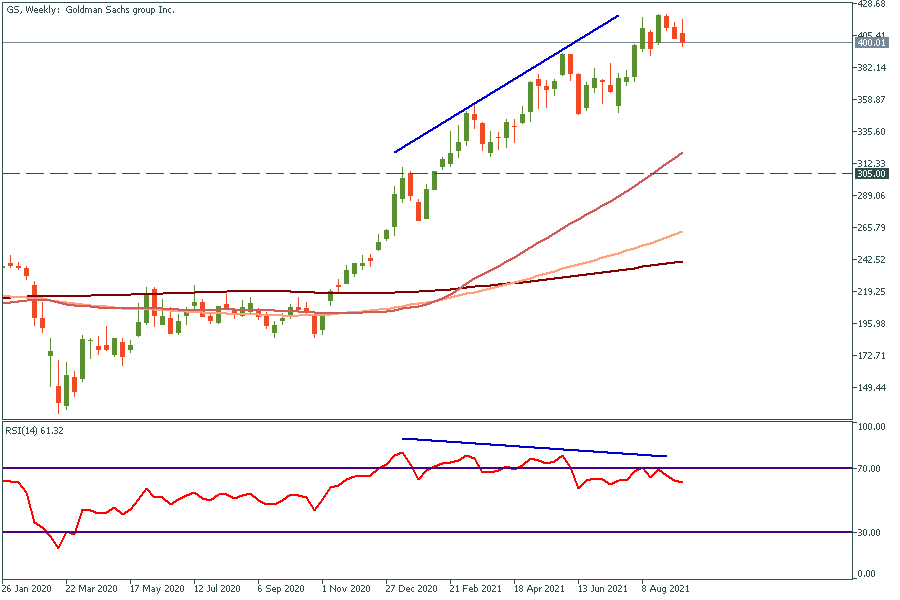
GS has a huge divergence on a weekly chart. The price will tend to play it out and head towards $305 in the middle-term period.
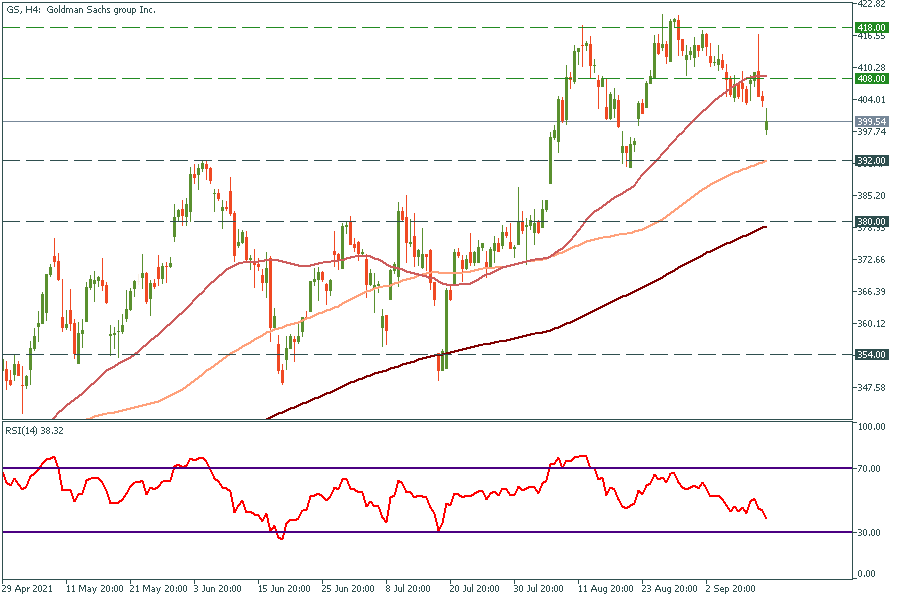
In short term, there is still a downtrend. Targets are $392, $380 and $354.