Trading Accounts
Trading Conditions
Financials
CFD Trading instruments

Don’t waste your time – keep track of how NFP affects the US dollar!
The ASIC policy prohibits us from providing services to clients in your region. Are you already registered with FBS and want to continue working in your Personal area?
Personal areaTechnical outlook and ideas for Forex pairs
Some traders like fundamental analysis, which includes news, macroeconomic events, and financial statements. Others prefer to “trade the chart”. They assume that the price chart includes everything they need to know. If you regard yourself as a technical trader, this article is for you! We have outlooked several promising Forex pairs so that you don’t have to.
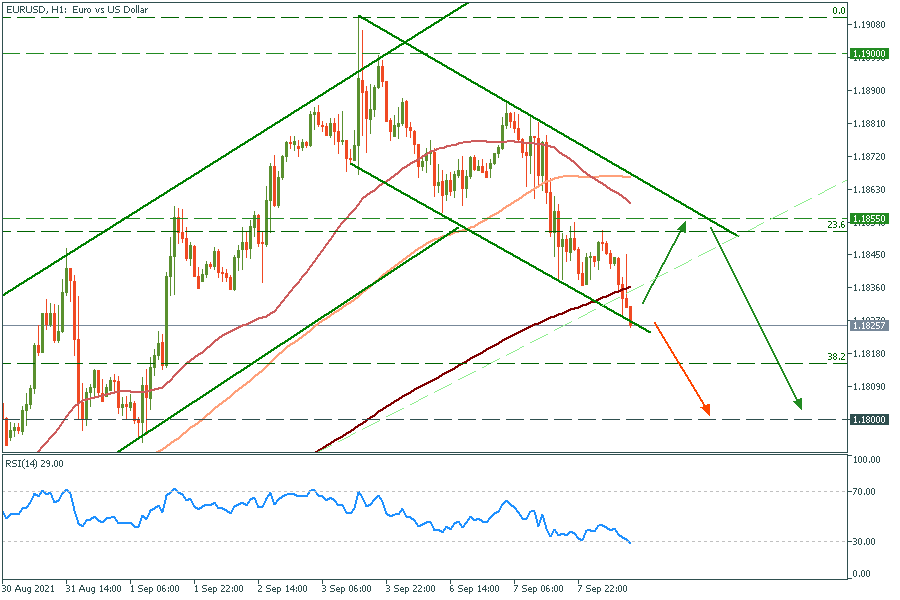
Euro has broken through an ascending channel and now trying to fall further. Dollar is strengthening, so we would expect a plunge to the 1.18 level. The rise of the euro is less likely and only will postpone the inevitable fall.
EUR/USD H1 chart
Support: 1.1818; 1.1800
Resistance: 1.8550; 1.1900
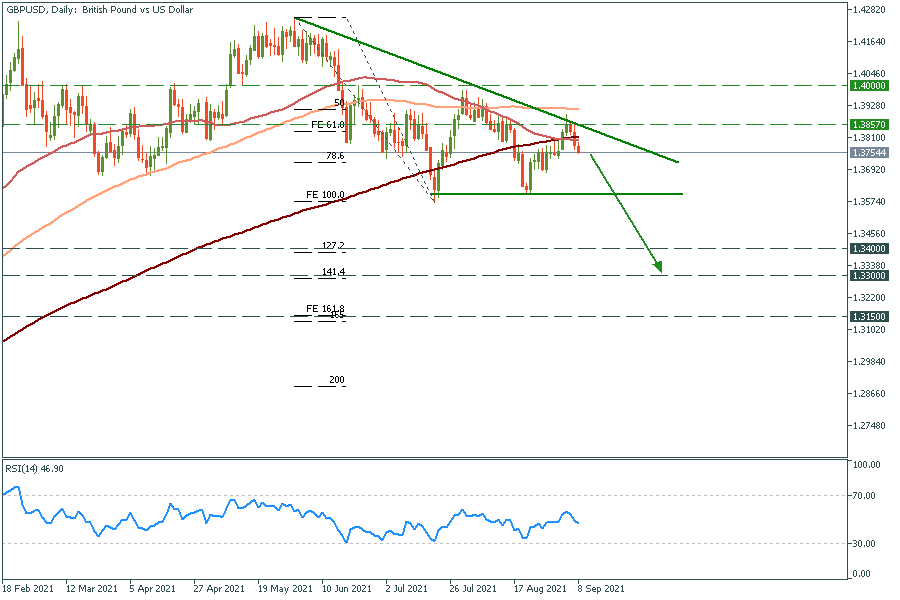
We get even more certain about the greenback movement when we look at the British pound chart. A nice accurate descending triangle is forming, divergence on RSI has already worked and we don’t see any signs of reversal movement. Fibonacci extensions help us set targets for this movement. By the way, we have a video about a Fibonacci tool, check it out!
GBP/USD daily chart
Support: 1.3400; 1.3300; 1.3150
Resistance: 1.3857; 1.4000
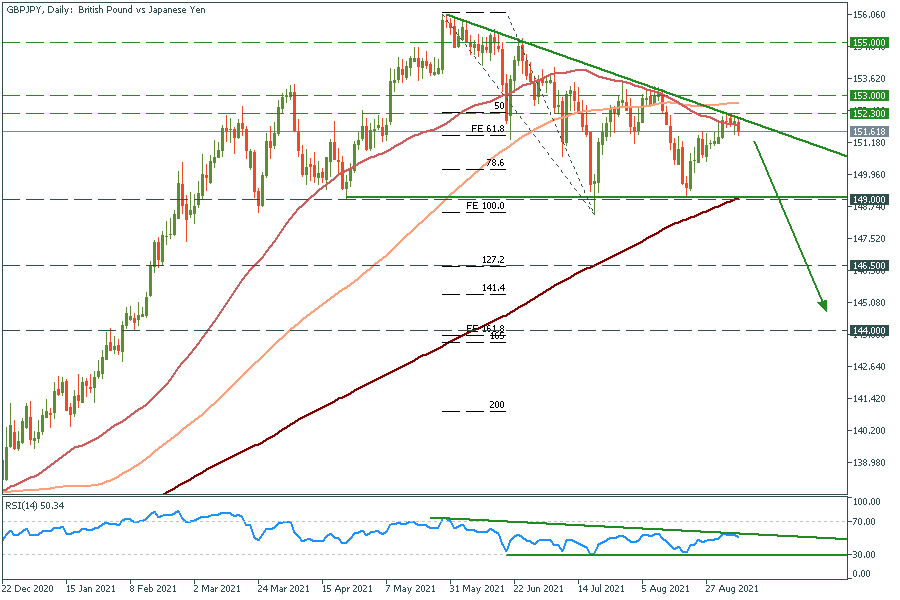
This pair is even more bearish than GBP/USD, so I would consider selling the pound in every pair. A descending triangle is forming for almost 5 months and RSI is ready to be broken downwards as well. Targets are on the chart and below this text.
GBP/JPY daily chart
Support: 149.0; 146.5; 144.0
Resistance: 152.3; 153.0; 155.0
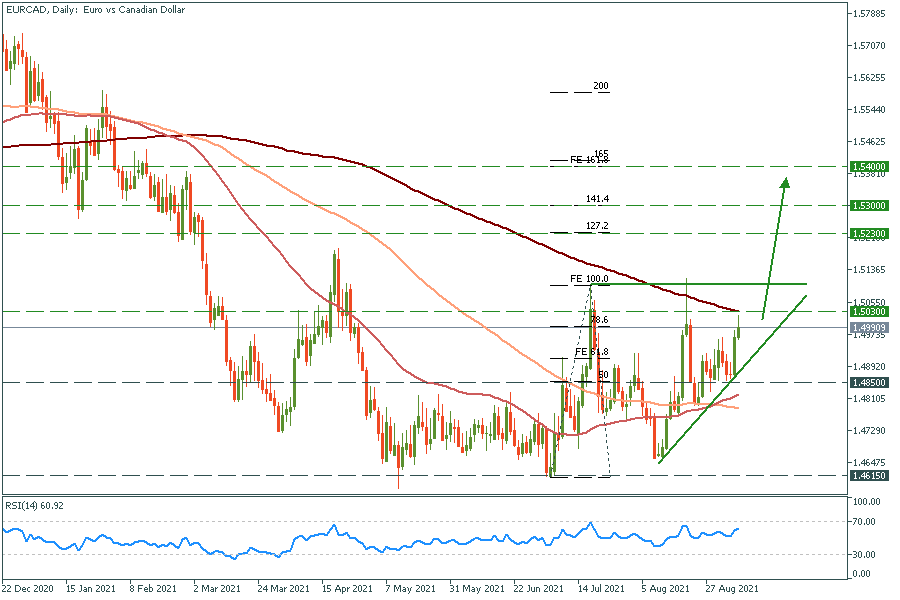
Euro has managed to overcome 50 and 100 moving averages on the daily chart and now the only serious resistance on its way to the moon is 200MA. Passing this area is just a matter of time.
EUR/CAD daily chart
Support: 1.4850; 1.4615
Resistance: 1.5030; 1.5230; 1.5300; 1.5400
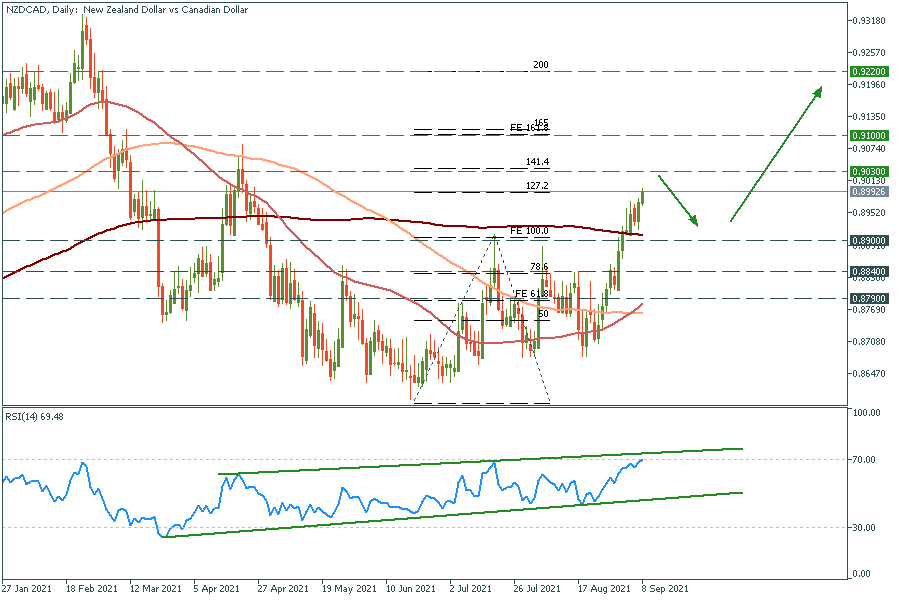
NZD/CAD
The technical strengthening of the New Zealand dollar is quite obvious if we look at NZD/CAD pair. On the daily chart, the breakout of the 200 moving average has been completed and after a small pullback (which might occur according to the RSI) the price will skyrocket to the highlighted levels.
NZD/CAD daily chart
Support: 0.8900; 0.8840; 0.8790
Resistance: 0.9030; 0.9100; 0.9220