Trading Accounts
Trading Conditions
Financials
CFD Trading instruments

Don’t waste your time – keep track of how NFP affects the US dollar!
The ASIC policy prohibits us from providing services to clients in your region. Are you already registered with FBS and want to continue working in your Personal area?
Personal areaDespite the fact that analysts and experts have been predicting the US stock market crash during pash year S&P500 doubled since March 2020 crush and NASDAQ is also gaining permanently. But there is one reason why we suggest shorting the US stocks and indexes (US500 and US100) in September.
We have analyzed the statistics data for the past 36 years and found out that September is the worst month for the US stock market. It might relate to the ending of the financial year in the United States, which starts on October 1 and finishes on September 31.
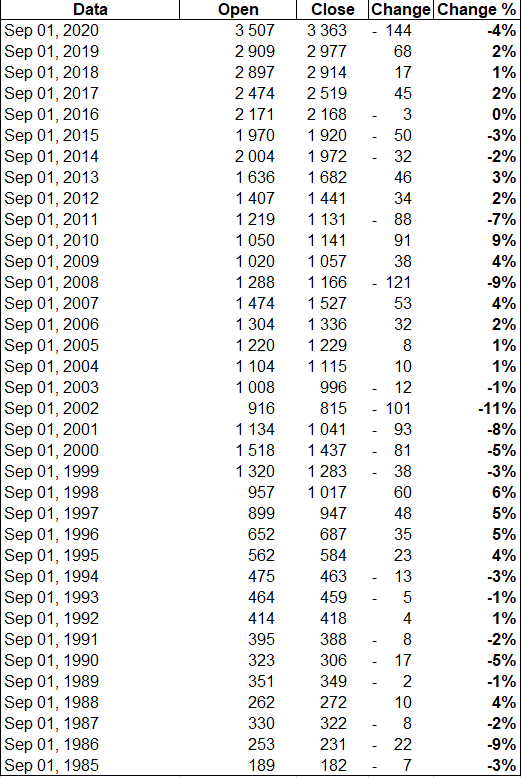
September S&P500 (US500) index performance since 1985.
Summarize the result of the S&P 500 (US500) index during the past 36 years.
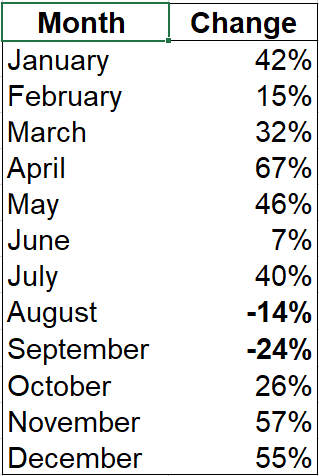
The best months for the US stock market have always been November and December as the stock always rallies ahead of Christmas weekend.
May and April are another strongest months. Traders even created the proverb “sell in May and go away”. It is an investment strategy for stocks based on a theory that the period from November to April inclusive has significantly stronger stock market growth on average than the other months.
S&P500 (US500)
Daily chart
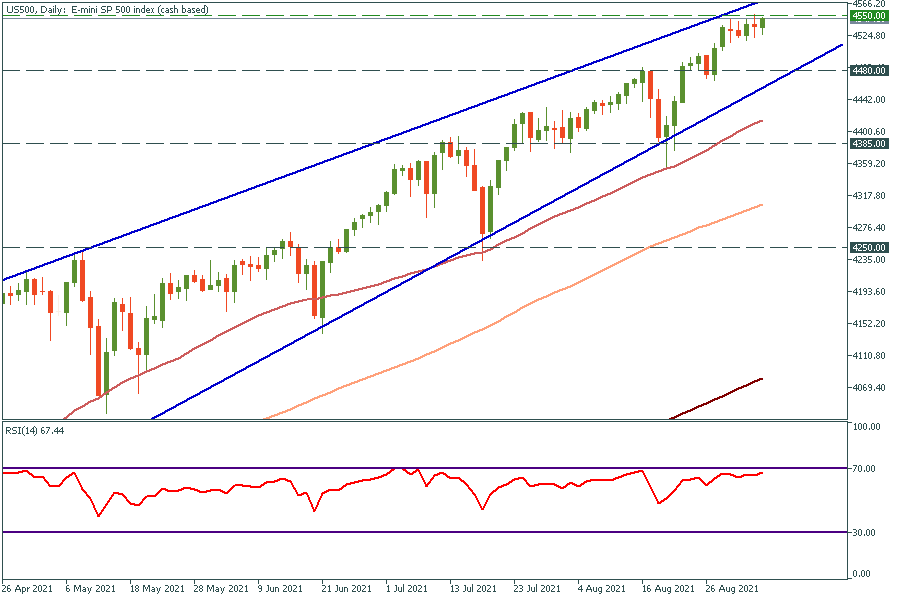
US500 came to the upper border of the rising wedge and stuck under 4550. According to the RSI, buyers haven’t been active during the past trading sessions and fear is growing as the community awaits news of stimulus tapering. A little spark can start a fire on the US stock market that’s why during September the best strategy will be to look for short trades. The best option will be to open a short trade as soon as the index hits the upper line of the wedge. The targets will be 4480 and 4385.
NASDAQ (US100)
Daily chart
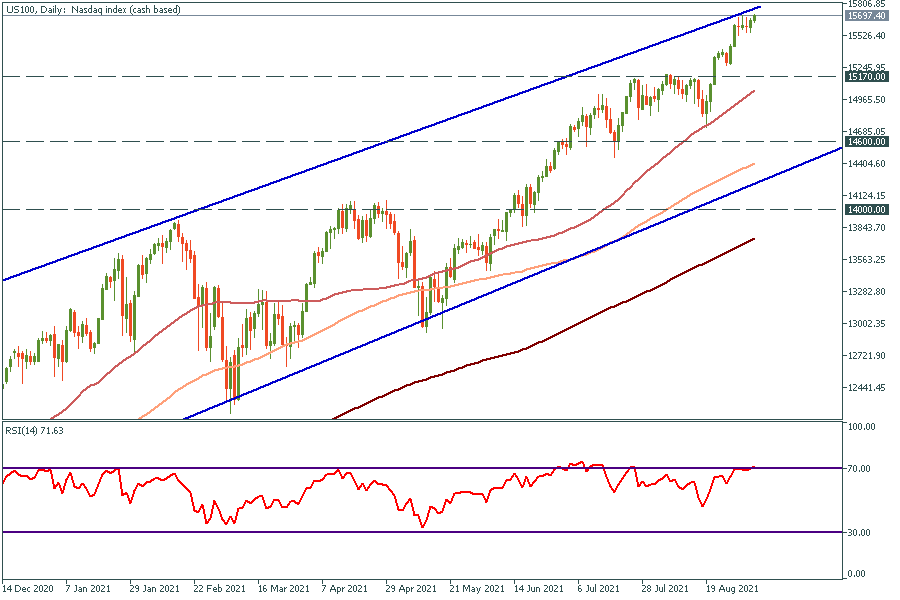
The same here. The RSI shows the index is in the overbought area and the price is touching the upper border of the rising channel. Short trade targets are 15 170, 14 600, and 14 000.