Trading Accounts
Trading Conditions
Financials
CFD Trading instruments

Don’t waste your time – keep track of how NFP affects the US dollar!
The ASIC policy prohibits us from providing services to clients in your region. Are you already registered with FBS and want to continue working in your Personal area?
Personal areaAt the end of the past week, Bitcoin broke through the big resistance level of $50 400 and reached $51 500 after the worse-than-expected US labor data. At this moment we expect the crypto asset to return to the $50 400 and retest it from above. If Bitcoin holds above this level on a daily timeframe, we will get a confirmation that the uptrend is not over yet and the next target will be $54 500.
Daily chart
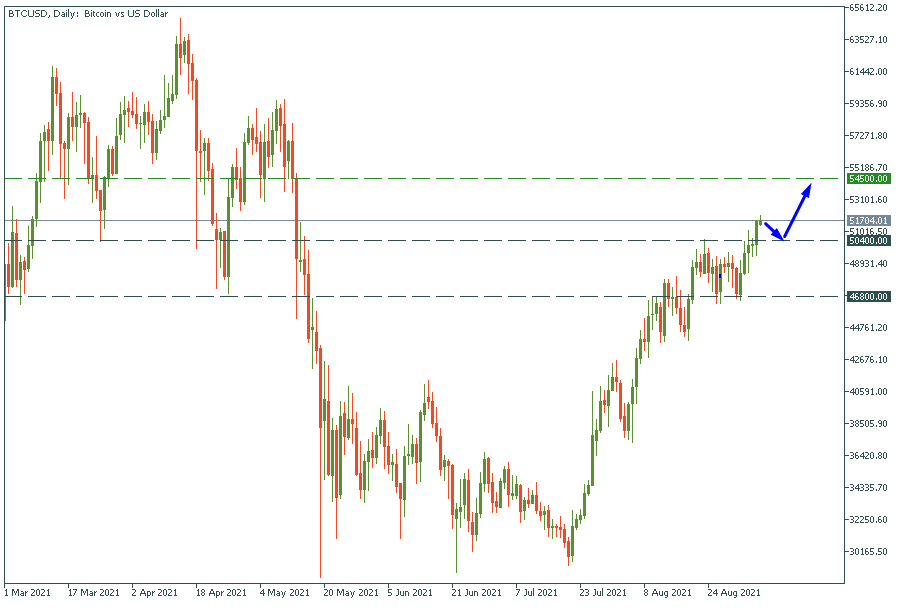
If Bitcoin breaks through $50 400 it might pull down to $46 800.
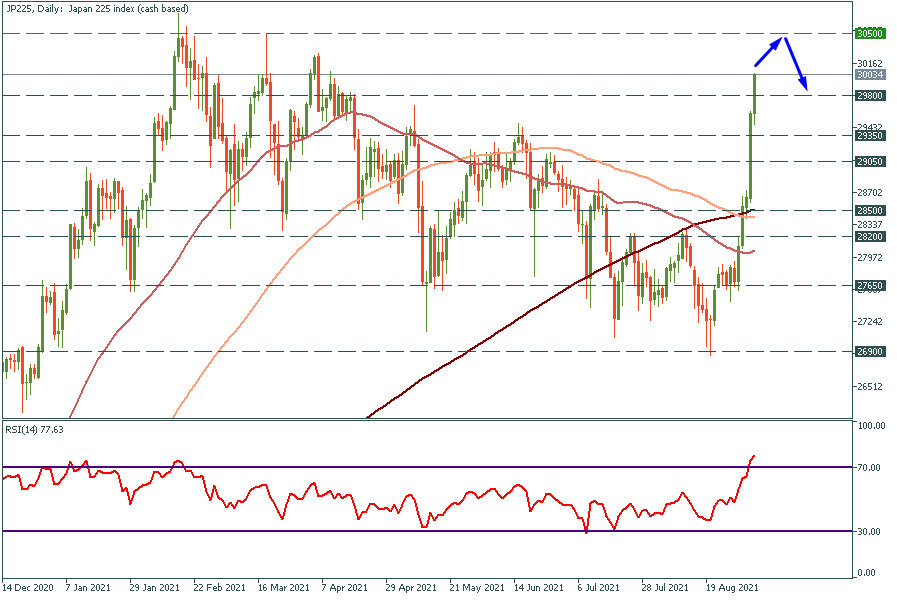
In the past week's daily market analyses video, we’ve discussed JP225 and predicted a huge pump with the target at $30 500. As you can see the “falling wedge” pattern worked perfectly, and the price is moving exactly by predicted scenario.
We expect a tiny pullback to happen as soon as the price will reach our target. The targets for this pullback will be $30 000 and $29 800.
Daily chart
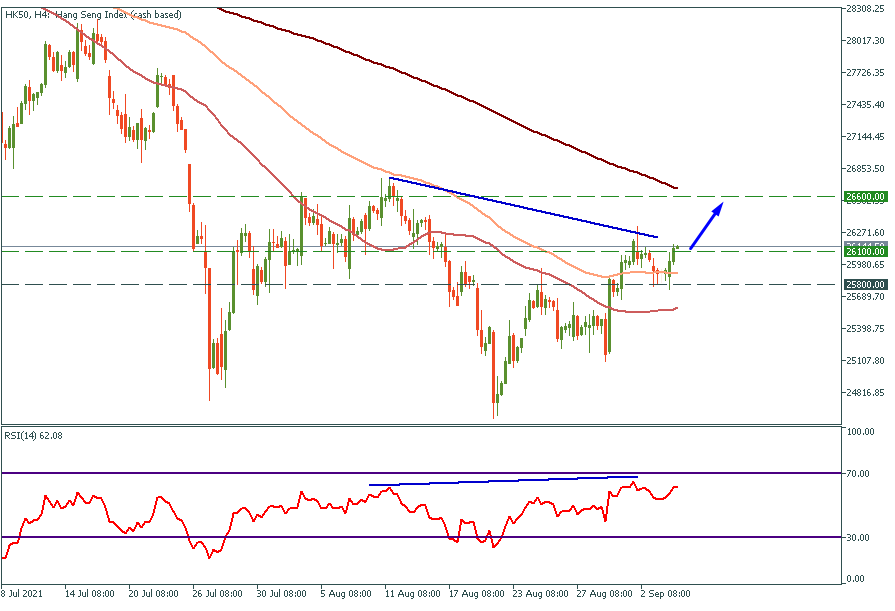
Chinese stock market still looks attractive. The RSI indicator shows buyers are interested as the “hidden divergence” occurred. We expect HK50 to hit our estimated goal at 26 600 during this week.
Daily chart
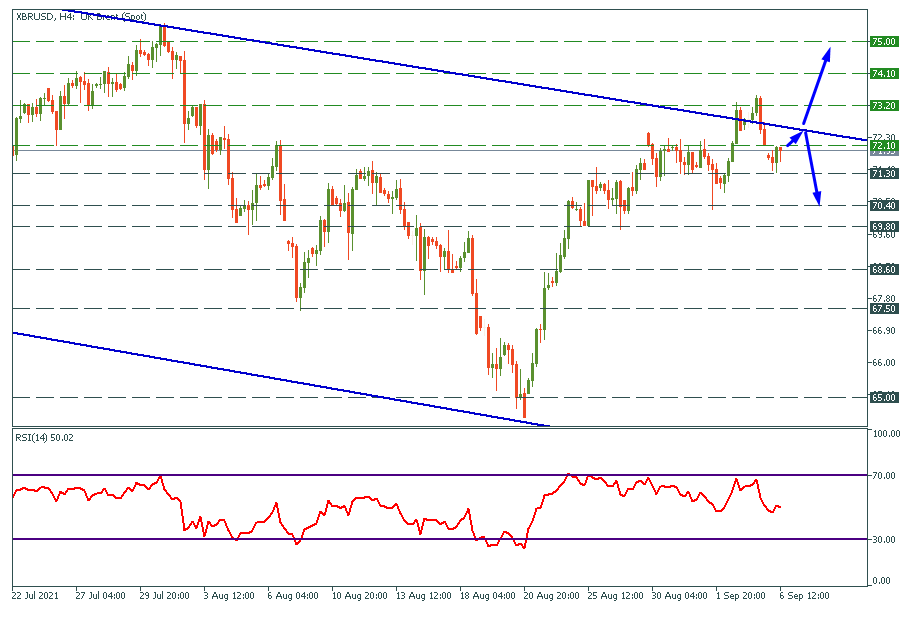
Brent returned to the falling channel by the end of the previous week. At this point the upper channel line should be watched carefully if the price holds above it on the daily chart, long trade might be opened, otherwise, if the price gets rejected from the “blue” resistance line once again we might think about short trade.
Resistance levels: $73.2; $74.1; $75.
Support levels: $71.3; $70.4.
4H chart
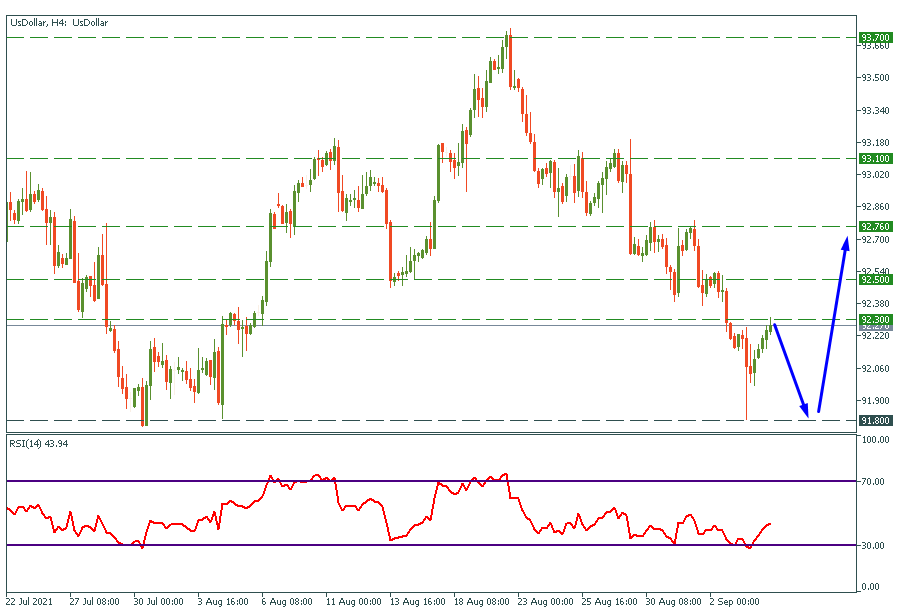
The US dollar has been falling during the whole previous week, but it looks like it found the bottom at 91.8. It might decline to 92 or 91.8, and at this point, it will be the best decision to buy USD/*** currency pairs and sell ***/USD currency pairs.
4H chart
