Trading Accounts
Trading Conditions
Financials
CFD Trading instruments

Don’t waste your time – keep track of how NFP affects the US dollar!
The ASIC policy prohibits us from providing services to clients in your region. Are you already registered with FBS and want to continue working in your Personal area?
Personal areaIn this article, we will discuss oil, gold, EUR/USD movements during the past week and try to find short- and long-term trading opportunities.
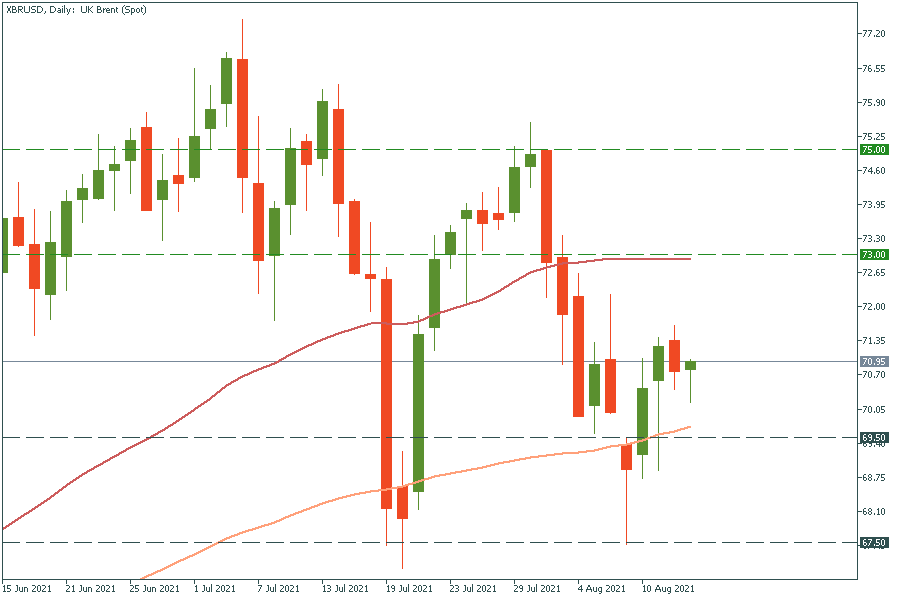
Oil demonstrated a positive dynamic during the past week after the massive drop. Data from the US Energy Information Administration on Wednesday showed that fuel demand of the top global crude user has averaged 20.6 million barrels per day (BPD) over the past four weeks, roughly in line with 2019 levels. OPEC agreed to boost oil supply by 400,000 BPD monthly, starting in August. However, there are still concerns that the increase will not be enough to meet demand as the US and Europe ease their coronavirus-induced movement restrictions.
In this case, $73 and $75 levels are the main targets for the upcoming week. You can find more relative technical analysis in the previous article related to oil.
Daily XBR/USD chart
EUR/USD
The currency pair came to the highly important support level at 1.171 after the US employment announcement.
The price has formed a “head and shoulders” pattern and 1-2-3 pattern, both point us to the upcoming decline with the target at 1.12. In short term, we expect to see a pullback up to 1.18 according to RSI and MACD oscillators. In this case, the price will retest the neckline and confirm the pattern. Let’s check both patterns!
Daily chart, “Head and shoulders”
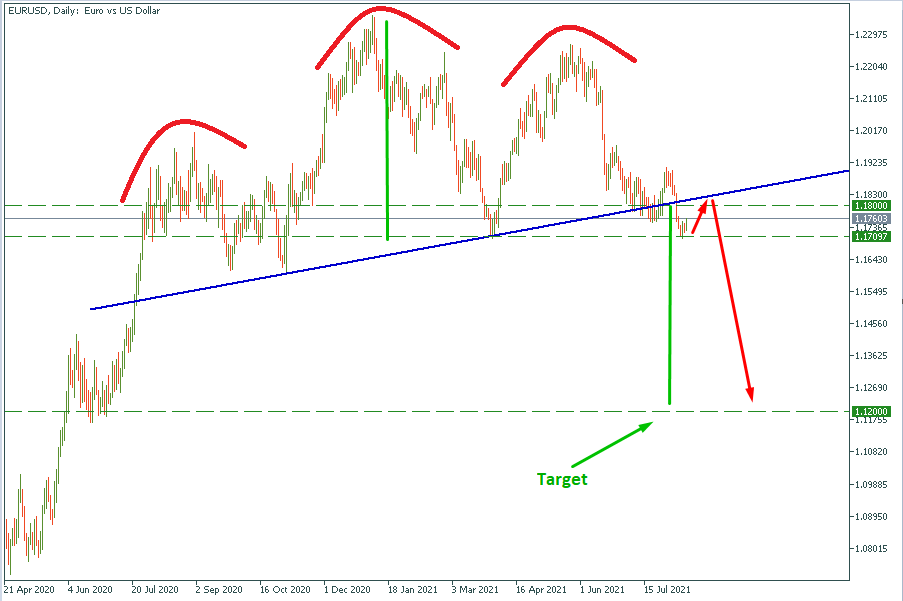
If the price retests neckline from the bottom and bounces off it, the “head with shoulders” patter will be confirmed.
Daily chart, “1-2-3 pattern”
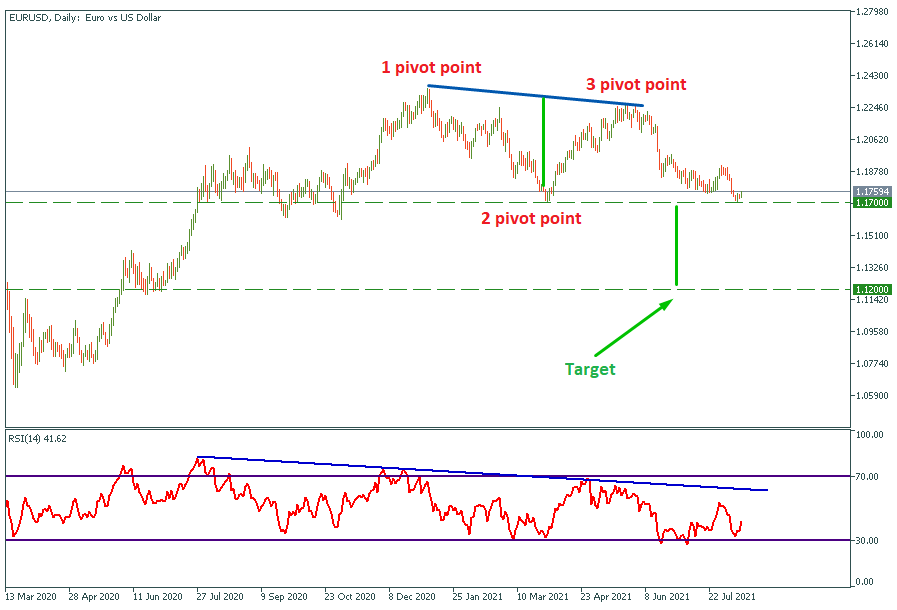
With the RSI divergence, the chart has formed a 1-2-3 pattern. The target measures as the vertical line connecting the 2-pivot point level and the middle point on the line between 1 and 3 pivot points. As soon as the price breaks through the 1.17 support level the pattern will be confirmed.