Trading Accounts
Trading Conditions
Financials
CFD Trading instruments

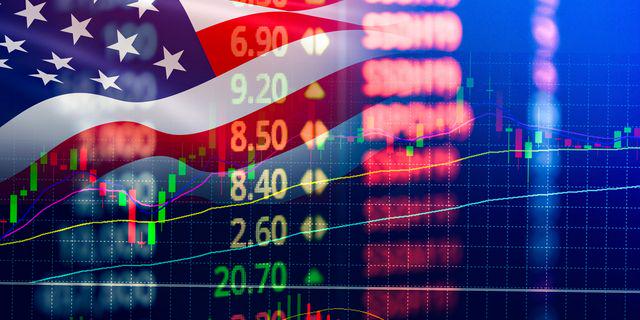
Don’t waste your time – keep track of how NFP affects the US dollar!
The ASIC policy prohibits us from providing services to clients in your region. Are you already registered with FBS and want to continue working in your Personal area?
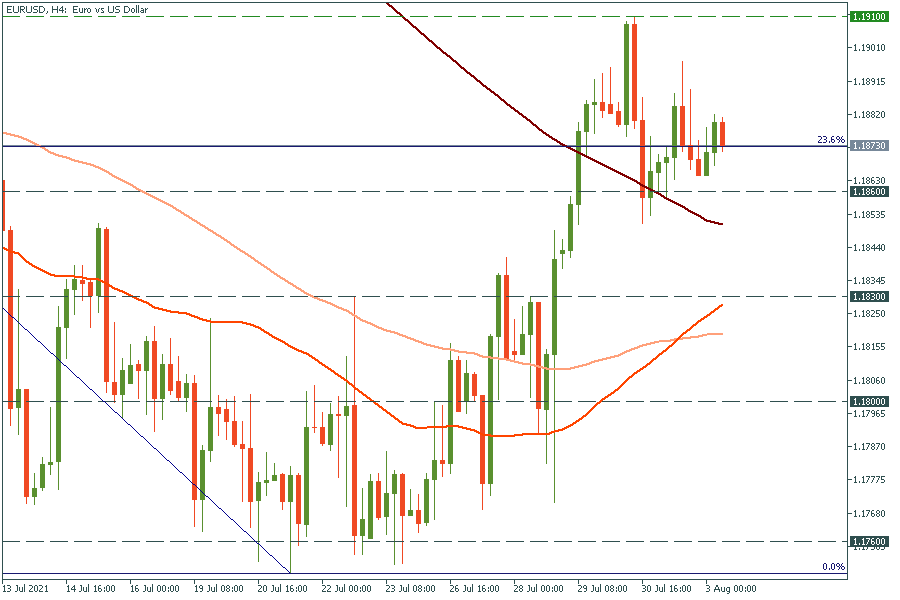
Personal areaEUR/USD is moving back and forth. If it drops below the recent low of 1.1860, it will fall to the 50-period moving average of 1.1830. On the flip side, if it breaks above 1.1890, it may jump to the psychological mark of 1.1910.
Gold has been falling for the third day in a row. The 100-day moving average at $1800 may become a serious obstacle. Thus, the metal may struggle to cross it and then reverse up from it. However, the two peaks at $1833 (the 50% Fibo level) look interesting. If gold drops below the 23.6% Fibonacci retracement level of $1790, the Double Top pattern will be confirmed.

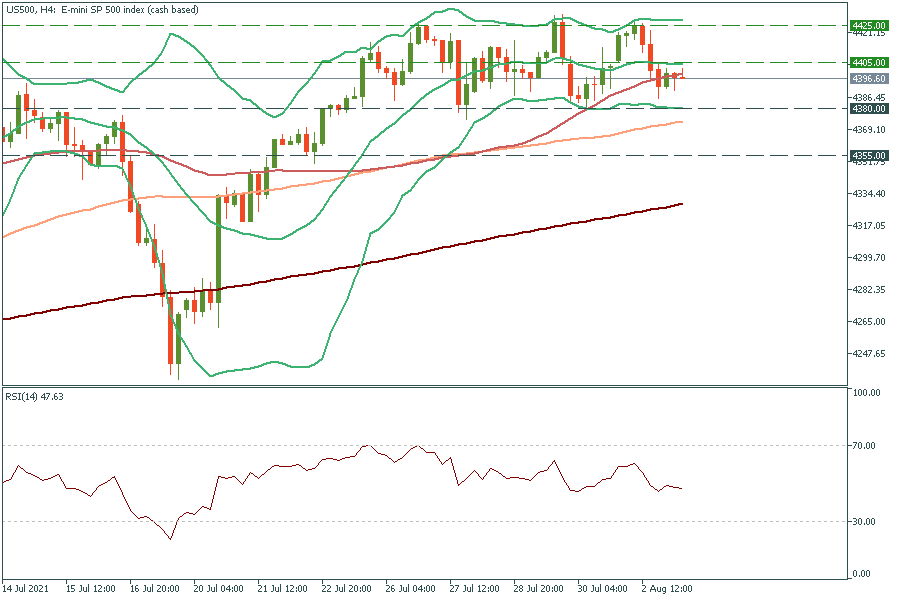
S&P 500 (US500) is easy to trade now! It’s moving sideways in a range between 4380 and 4425. We even have a special strategy for this kind of situation, which you can read in our article “Strategy For Flat Trading: Rubber Band”. Based on this strategy, if the price reaches the lower line of Bollinger Bands at 4380, it will reverse up. If it touches the upper line of 4425, it can reverse down.