Trading Accounts
Trading Conditions
Financials
CFD Trading instruments

Don’t waste your time – keep track of how NFP affects the US dollar!
The ASIC policy prohibits us from providing services to clients in your region. Are you already registered with FBS and want to continue working in your Personal area?
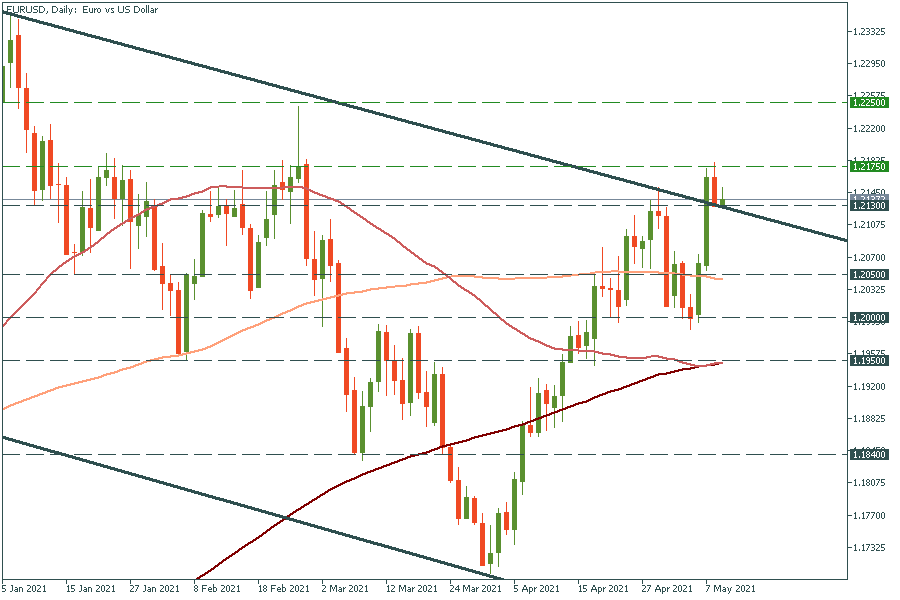
Personal areaEUR/USD has broken through the upper trend line at 1.2130. It retraced to this line, but it should be just a natural short sell-off ahead of the further rally up. On the way up, the pair will meet resistance levels at 1.2175 – the recent high and 1.2250 – the high of February 25. However, if the sentiment changes, the pair may fall to the 100-day moving average of 1.2050 and the one-week low of 1.2000.
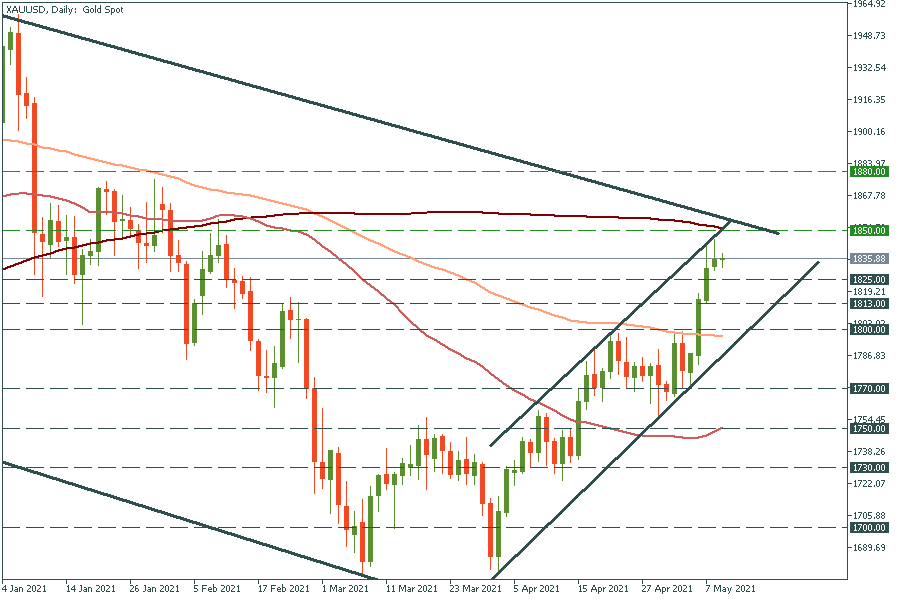
Gold is getting closer to the upper trend line of the descending channel, which coincides with the 200-day moving average of $1850. If it manages to break it, the way up to the highs of late January of $1875 will be open. In the opposite scenario, the move below the $1825 support will press the metal further down to $1813 – the intraday low of May 6.
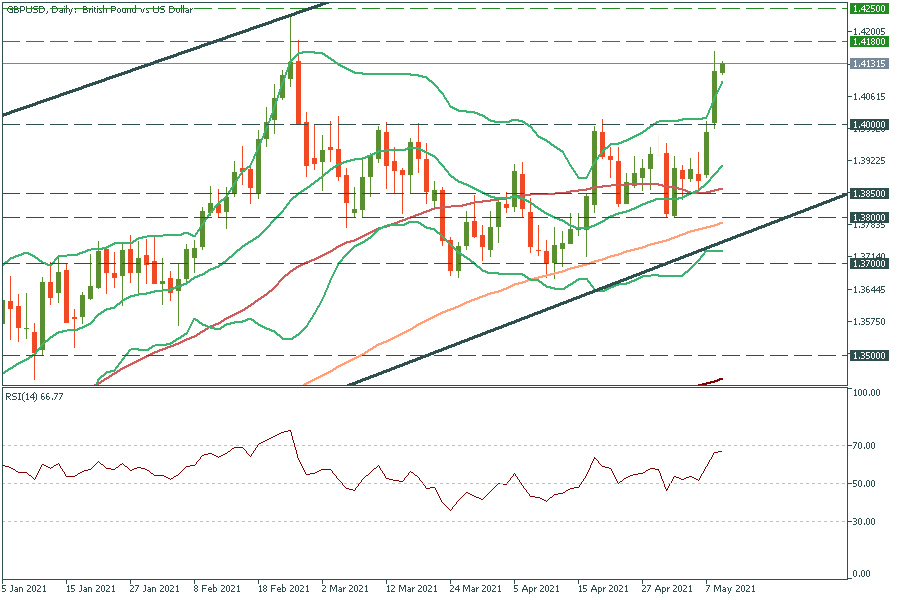
GBP/USD has broken through the psychological mark of 1.4000 since political risks eased in the UK. It looks like the pair is overbought: the price went above the upper line of Bollinger Bands and the RSI indicator flattened just below the 70.00 level. On the smaller timeframes, GBP/USD has already reversed down. Therefore, it may retest 1.4000 again.