Trading Accounts
Trading Conditions
Financials
CFD Trading instruments

Don’t waste your time – keep track of how NFP affects the US dollar!
The ASIC policy prohibits us from providing services to clients in your region. Are you already registered with FBS and want to continue working in your Personal area?
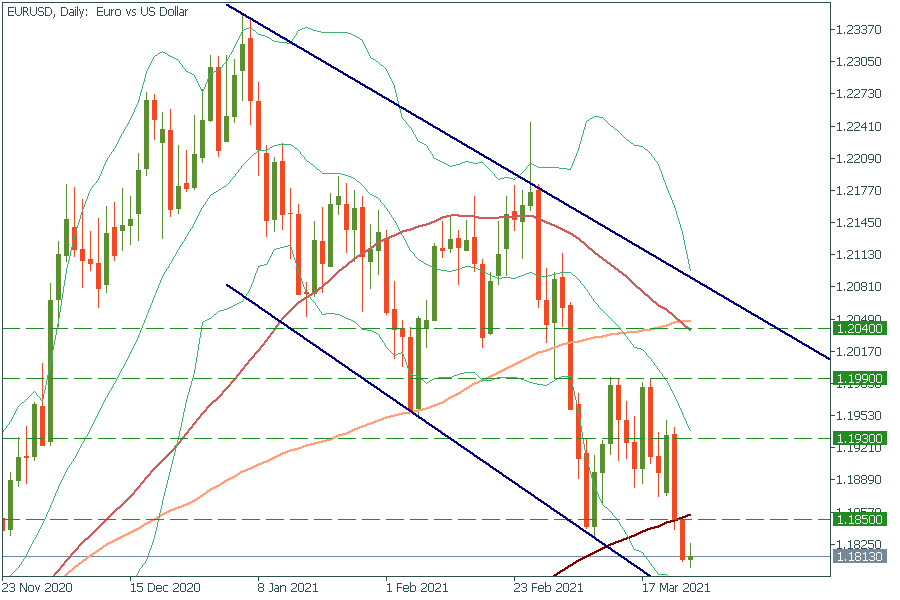
Personal areaEUR/USD has been trading in a descending channel. It has broken through the 200-day moving average at 1.1850. Thus, the way down to the next support level at the lower line of Bollinger Bands at 1.1775 is open now. It’s unlikely to break it on the first try. But if it does, it may fall to the key psychological mark of 1.1700. On the flip side, if it breaks the resistance of 1.1850, the way up to the middle line of Bollinger Bands at 1.1930 will be open.
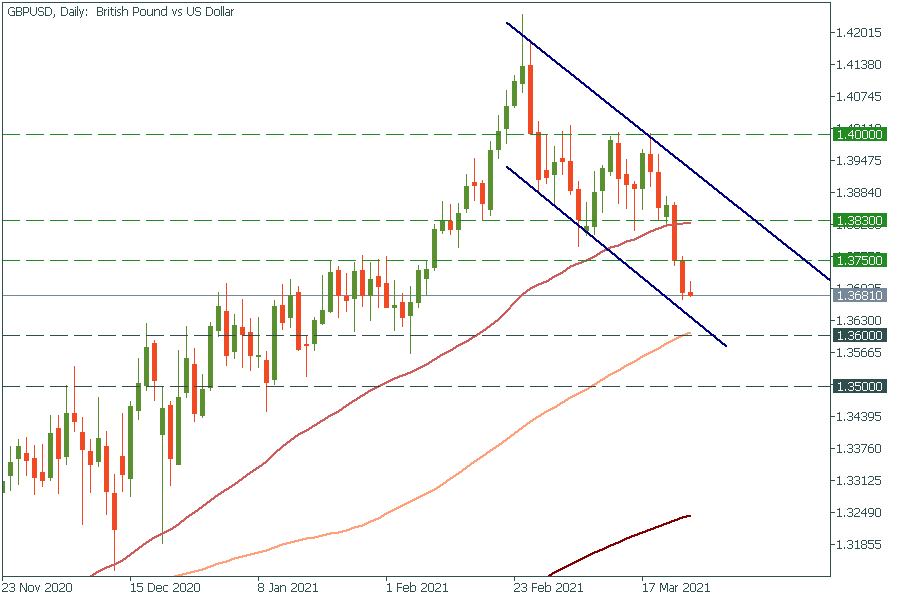
GBP/USD is moving down inside the descending channel. It’s approaching the 100-day moving average of 1.3600, which it’s unlikely to cross on the first try. If it manages to do so, the way down to the next support of 1.3500 will be open. If the sentiment changes during the day, GBP/USD may jump above 1.3750 which will open doors towards the 50-day MA at 1.3830.
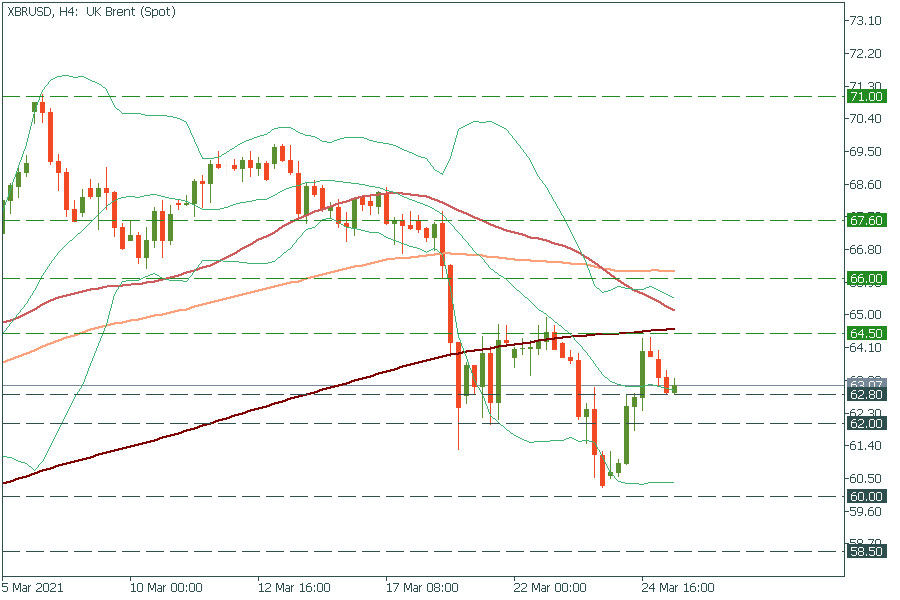
The news about a ship getting stuck in the Suez Canal was negative for oil. Thus, now we can observe the increased volatility in all the crude oil assets. For instance, let’s look at UK Brent oil – XBR/USD. It has bounced off the 200-period moving average of $64.50, but the middle line of Bollinger Bands constrained the asset from further falling. If it breaks it, the oil may fall to the next support of $62.00. In the opposite scenario, the move above the 200-period MA at $64.50 will drive XBR/USD to $66.00.