Trading Accounts
Trading Conditions
Financials
CFD Trading instruments

Don’t waste your time – keep track of how NFP affects the US dollar!
The ASIC policy prohibits us from providing services to clients in your region. Are you already registered with FBS and want to continue working in your Personal area?
Personal areaThe US dollar keeps strengthening due to the fresh Covid-19 outbreaks in some parts of the world. By the way, the US NFP report will be out already this Friday, and positive expectations are boosting the USD as well. The better the NFP outcome – the more chances the Federal Reserve might start tapering stimulus. US ADP came out better than analysts expected. This report gives an early outlook on US employment, that’s why NFP should be strong as well.
EU inflation came out exactly as forecasted: 1.9%. The number had no impact on the euro as EUR/USD keeps falling due to the strong USD.
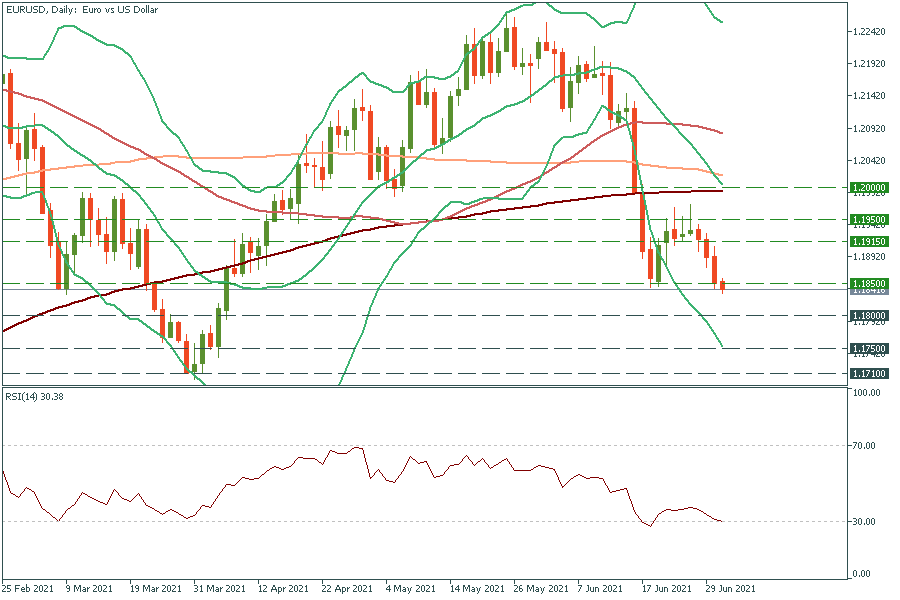
EUR/USD has broken through the key support level of 1.1850 and edging lower to the psychological mark of 1.1800. It’s unlikely to break it on the first try, but if it does, the way down the lows of early April at 1.1750 will be clear. The RSI indicator shows that the euro gets closer to the oversold area.

Oil rose ahead of the OPEC+ meeting today. The alliance is expected to increase oil output by 500,000 barrels a day. Besides, a pause in US-Iran nuclear talks drags on, and that pushes oil prices up as well.
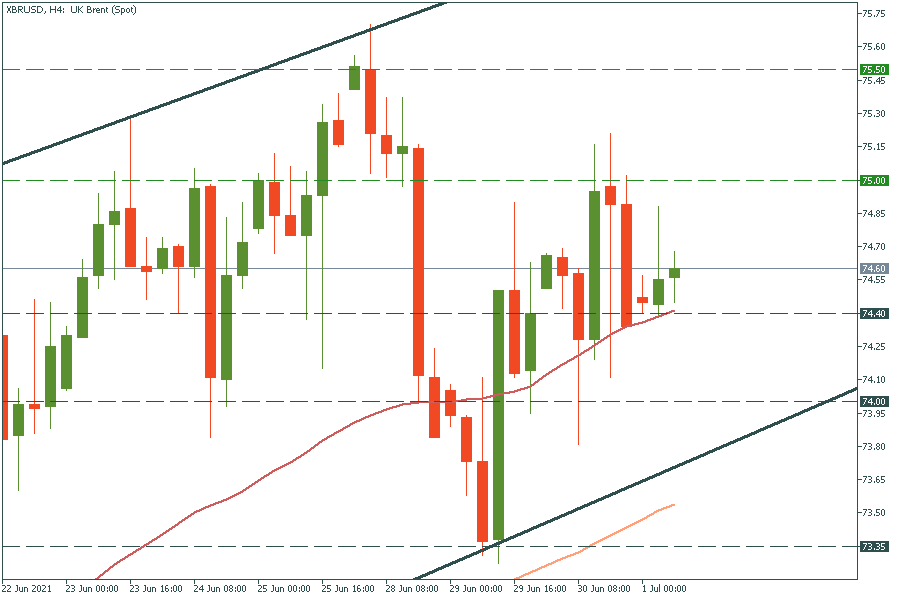
XBR/USD is well supported by the 50-period moving average at $74.40. Today, we might expect oil to rally up to the $75.00 resistance level. The price won’t break this threshold on the first try, but when it does, the way up to $75.50 will be open.

Canadian GDP dropped less than anticipated, which is a positive factor for the Canadian dollar. Thus, we might observe the CAD rises against other currencies except for the strong USD. USD/CAD is edging higher despite this positive data. For example, if you open GBP/CAD or CAD/JPY, you’ll see that the CAD is rising.
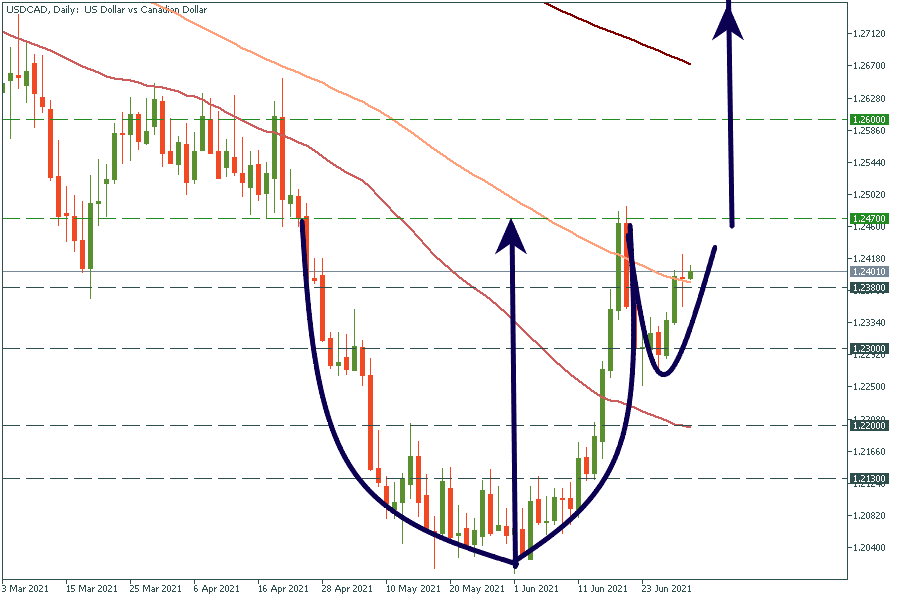
By the way, there is an interesting situation on the USD/CAD chart. The Cup and Handle pattern has almost occurred. It would be complete when the price reaches the 1.2470 mark. When it breaks this resistance level, it will rally up to the late-April highs of 1.2600. Support levels are the 100-day moving average of 1.2380 and the low of June 25 at 1.2300.
