Trading Accounts
Trading Conditions
Financials
CFD Trading instruments

Don’t waste your time – keep track of how NFP affects the US dollar!
The ASIC policy prohibits us from providing services to clients in your region. Are you already registered with FBS and want to continue working in your Personal area?
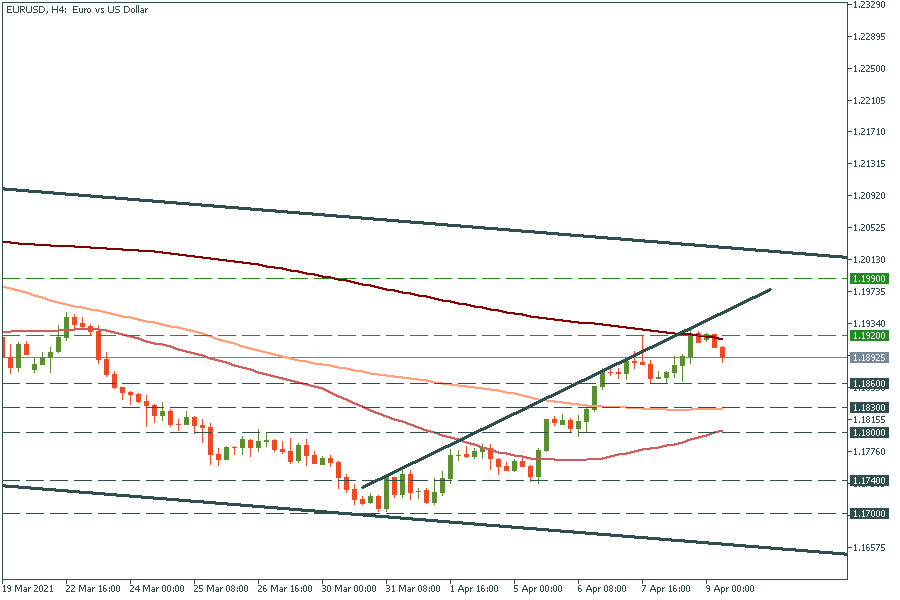
Personal areaEUR/USD bounced off the 200-period moving average of 1.1920. Now it’s getting closer to the low of April 7 at 1.1860. If it manages to break it, the way down to the 100-period moving average at 1.1830 will be open. On the flip side, the move above the 1.1920 resistance will push the pair to the high of March 18 at 1.1990.
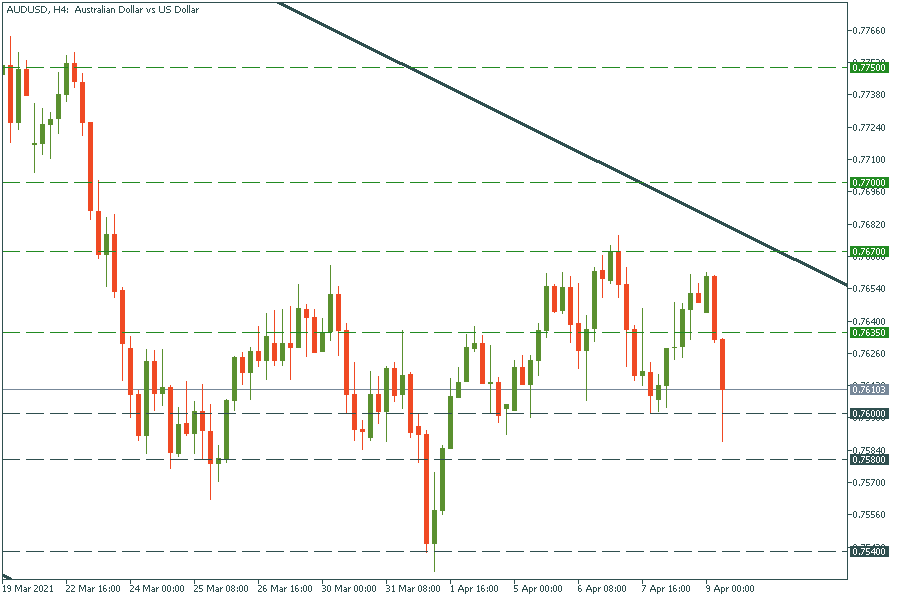
AUD/USD has just broken the low of April 7 at 0.7600. If it manages to break the next support of 0.7580, the way down to April’s low of 0.7540 will be open. Resistance levels are at the recent highs of 0.7635 and 0.7670.
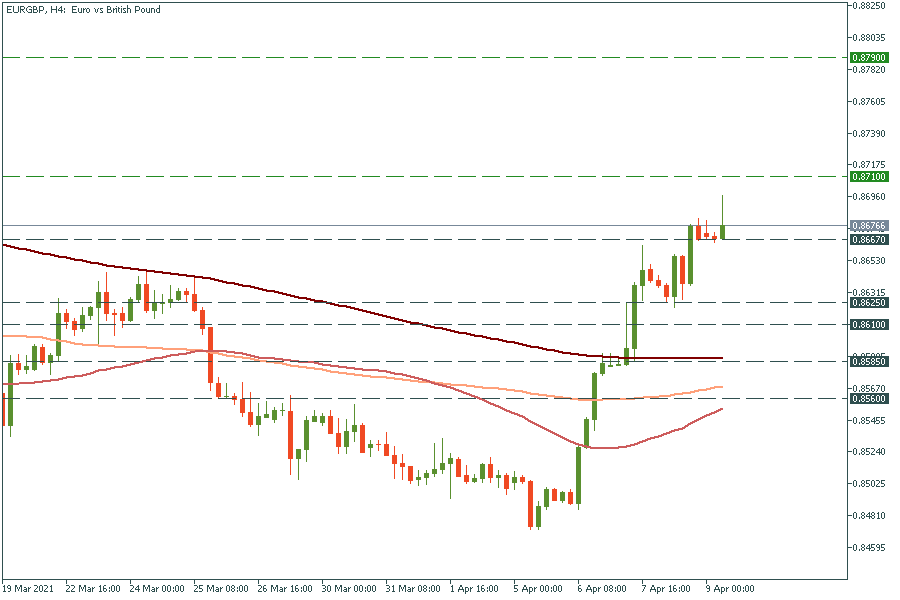
There are some big swings on the EUR/GBP pair. The price is edging higher to the high of February 26 of 0.8710. If it manages to break it, the way further up to the high of February 12 at 0.8790 will be open. On the flip side, the move below yesterday’s low of 0.8667 will press the pair down to the next support of 0.8625.
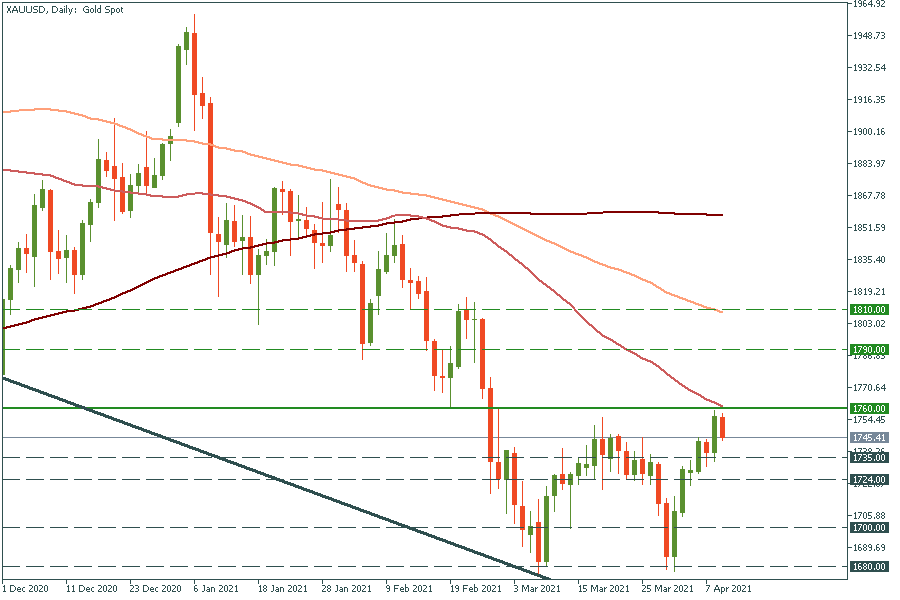
The double bottom pattern has occurred in the gold chart. The neckline lies at $1760, which coincides also with the 50-day moving average. Once the price crosses this level, it should skyrocket to the high of February 19 at $1790 and then to the 100-day moving average of $1810. However, the dollar’s rebound may ruin all these plans. So, if gold drops below yesterday’s low of $1735, the way down further to $1724 will be clear.