Trading Accounts
Trading Conditions
Financials
CFD Trading instruments

Don’t waste your time – keep track of how NFP affects the US dollar!
The ASIC policy prohibits us from providing services to clients in your region. Are you already registered with FBS and want to continue working in your Personal area?
Personal areaUSD/TRY had a huge swing up to 8.4500 but then slumped below 8.000. Societe Generale forecasts deeper losses for the Turkish lira as Erdogan leaves Turkey "beyond the point of no return". It may trigger a fresh record low in the lira and will drive USD/TRY above 8.0000 again. If it manages to break this resistance, the way up to the intraday high 8.4500 will be open.

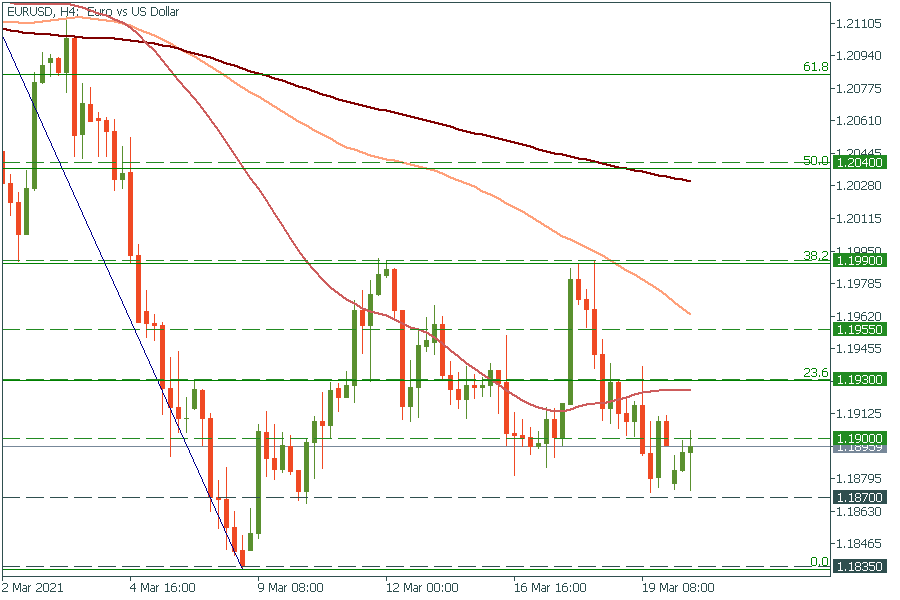
EUR/USD is moving down. It has failed to cross the support level of 1.1870 so far. But if it breaks it, the way down to the low of March 9 at 1.1835 will be clear. On the flip side, the move above the key psychological mark of 1.1900 will open doors towards the 23.6% Fibonacci retracement level of 1.1930.
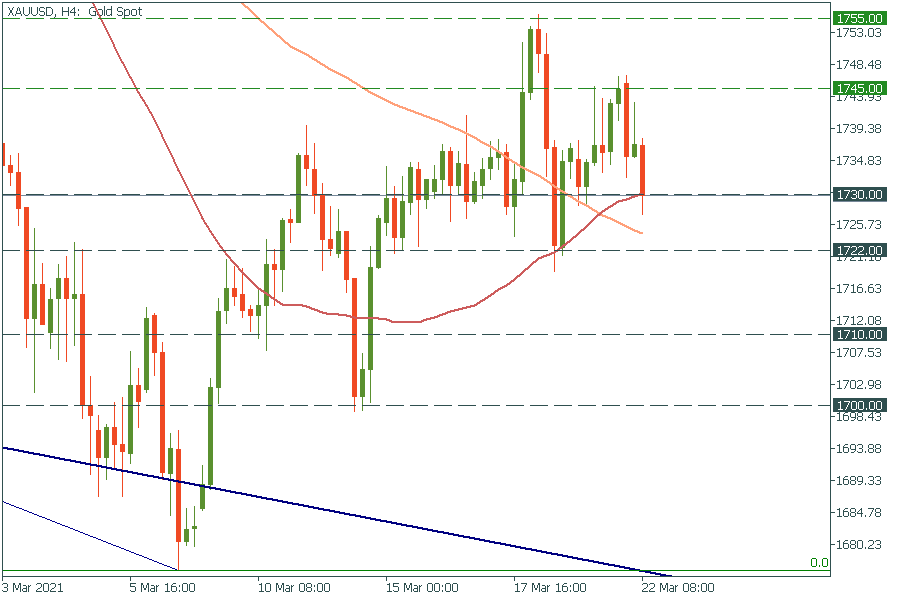
Let’s move on to gold. It has approached the 50-period moving average of $1730. If gold breaks this support, the way down to the 100-period moving average of $1722 will be clear. On the flip side, if it bounces off, the way up to the recent highs of $1745 and $1755 will be open.
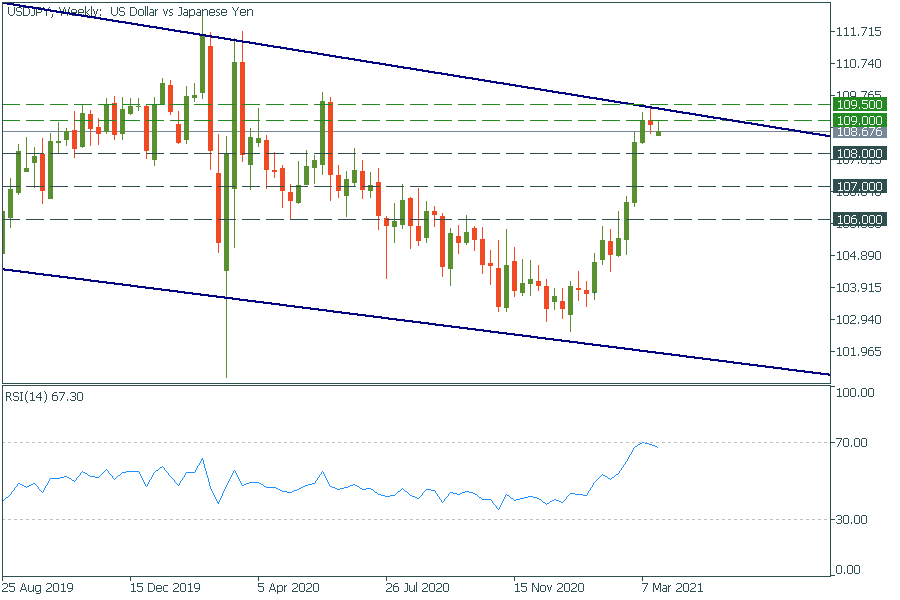
USD/JPY has touched the upper line of the channel on the weekly chart. Thus, it’s more likely to move down further as the RSI indicator turns down, bouncing from the 70.0 level. If it breaks the psychological level of 108.00, it may fall to the next support of 107.00. Just in case, resistance levels are 109.00 and 109.50.
Follow the speech of Fed Chair Powell at 15:00 MT.