Trading Accounts
Trading Conditions
Financials
CFD Trading instruments

Don’t waste your time – keep track of how NFP affects the US dollar!
The ASIC policy prohibits us from providing services to clients in your region. Are you already registered with FBS and want to continue working in your Personal area?
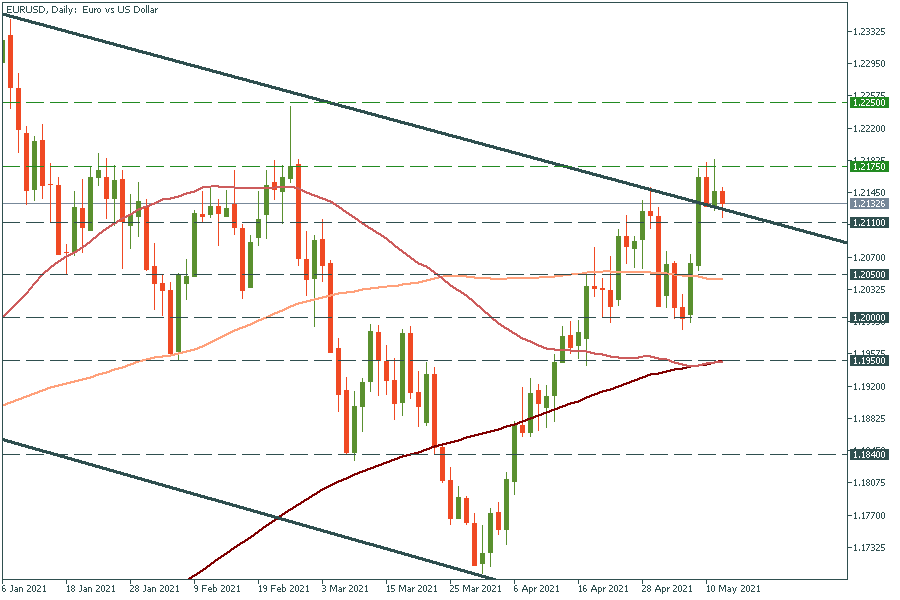
Personal areaEUR/USD is trading sideways. The upper trend line of the channel has transformed from the resistance to the support level for the pair. If it breaks the recent high of 1.2175, the way up to the high of February 25 at 1.2250 will be open. However, if it drops below 1.2110, it may fall to the 100-day moving average of 1.2050.
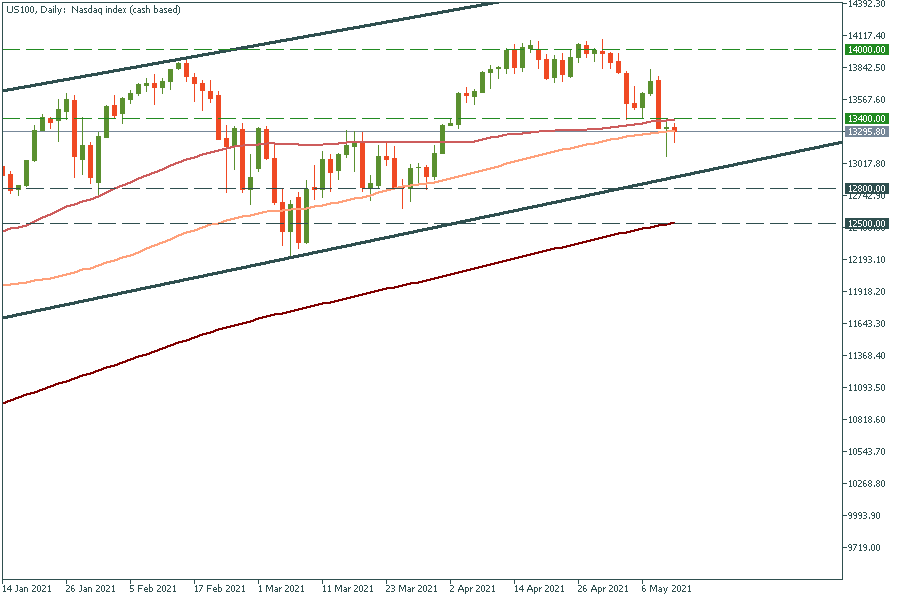
Nasdaq (US 100) dropped and approached the lower trend line near 13,000. It’s unlikely to cross this support level as it has failed to do so several times this and last year. Since it’s trading inside the ascending channel since August 2020, we might expect the tech stock index to keep moving up. If it breaks above the 50-day moving average of 13,400, the way up to the recent high of 13,750 will be open and then after some time to 14,000. Such broad indices as Nasdaq or S&P 500 always go up in the long term.
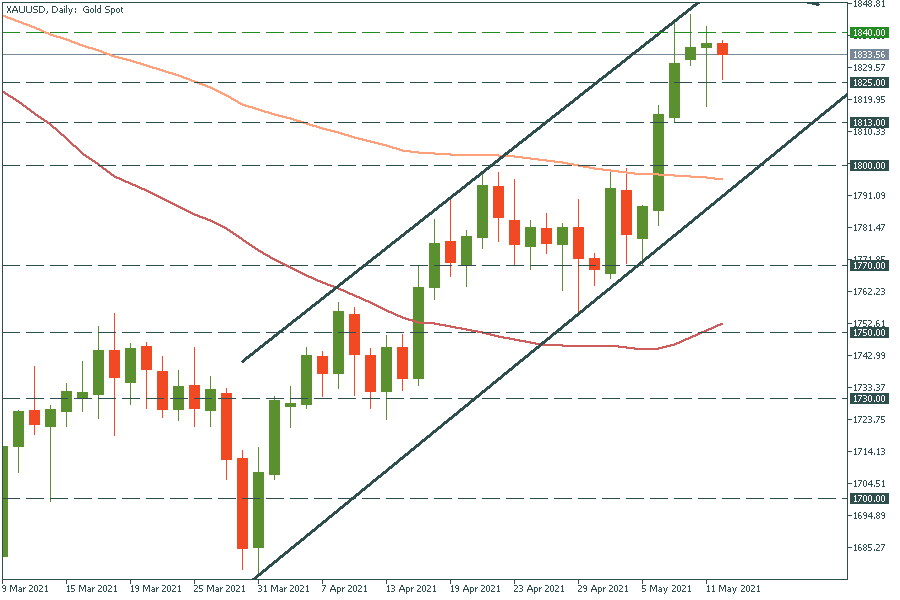
The decisive moment for gold is on the chart! On the weekly chart, there is a 50-week moving average just above the current price that stops gold from further rising. On the daily chart, there are resistance levels at the 200-day moving average and the upper trend line at $1850. If it finally manages to break them, the way up to $1875 will be open. Gold is viewed as a hedge against inflation, that’s why if inflation hikes today, the metal may advance. Just in case, be aware of support levels at the recent lows of $1825 and $1813.