Trading Accounts
Trading Conditions
Financials
CFD Trading instruments

Don’t waste your time – keep track of how NFP affects the US dollar!
The ASIC policy prohibits us from providing services to clients in your region. Are you already registered with FBS and want to continue working in your Personal area?
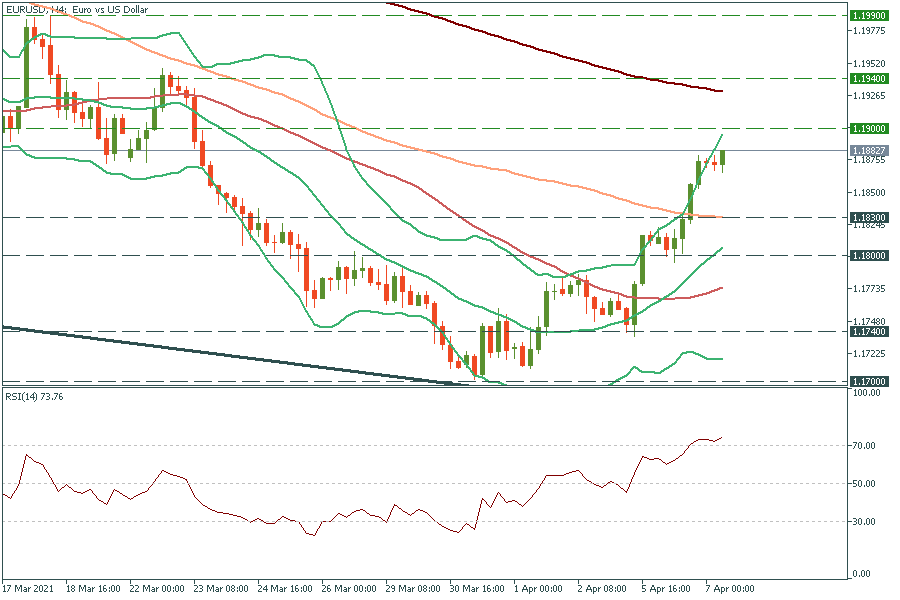
Personal areaEUR/USD has approached the psychological mark of 1.1900. Technical indicators point to the soon reverse down: the RSI indicator rose above 70.00, the price is close to the upper line of Bollinger Bands, and on the daily chart there is the 200-day moving average just above the current price. Thus, the pair may fail to cross the resistance of 1.1900 and reverse down. Support levels are the 100-period moving average of 1.1830 and yesterday’s low of 1.1800.

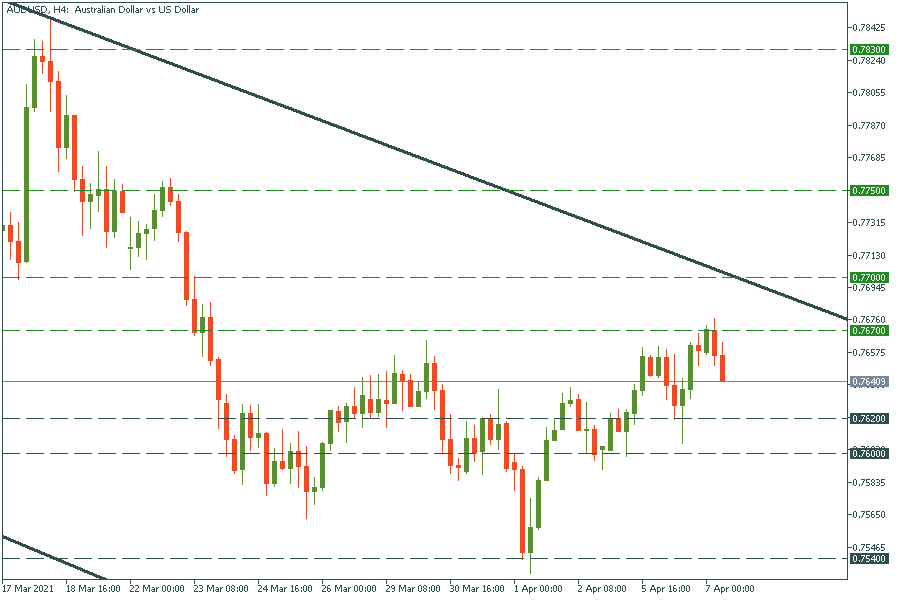
AUD/USD is moving in a descending channel in the long term. Since it is close to the upper trend line, it’s likely to reverse down soon. If it breaks yesterday’s low of 0.7620, the way down to the next support of 0.7600 will be open. On the flip side, if bulls take control and drag the price above the intraday high of 0.7670, it may jump higher to the next resistance of 0.7700.

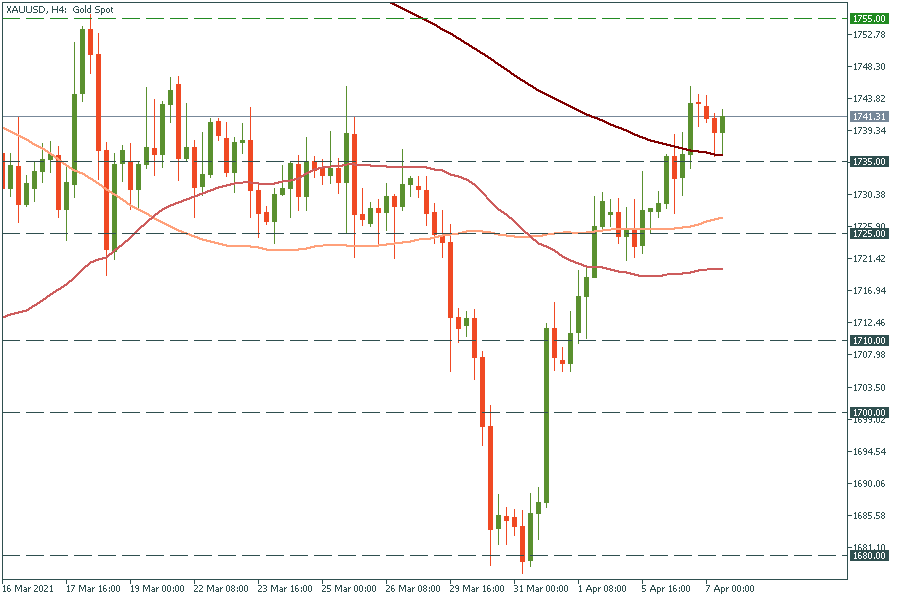
Gold is edging up and up. It has bounced off the 200-period moving average of $1755. Thus, the way up to the high of March 18 at $1755 is open. If it manages to break it, it may rally up further to the high of February 18 at $1790. In the opposite scenario, the move below the $1755 support will lead the yellow metal to the 100-period moving average of $1725.
