Trading Accounts
Trading Conditions
Financials
CFD Trading instruments

Don’t waste your time – keep track of how NFP affects the US dollar!
The ASIC policy prohibits us from providing services to clients in your region. Are you already registered with FBS and want to continue working in your Personal area?
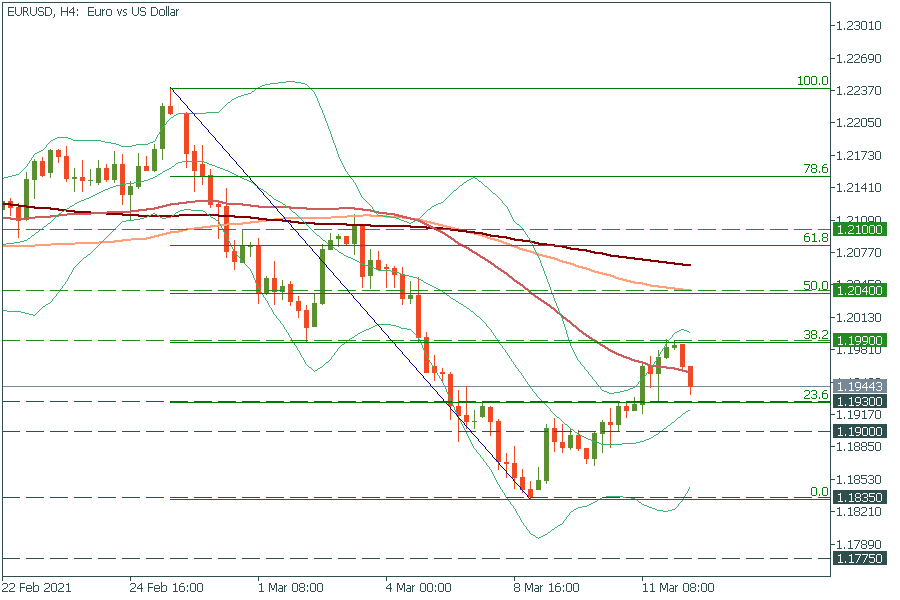
Personal areaEUR/USD bounced off the 38.2% Fibonacci retracement level at 1.1990. Thus, it’s more likely to drop to the 23.6% Fibo level of 1.1930, which it should have struggles to cross as it lies on the middle line of Bollinger Bands as well. Therefore, the pullback should happen at 1.1930.

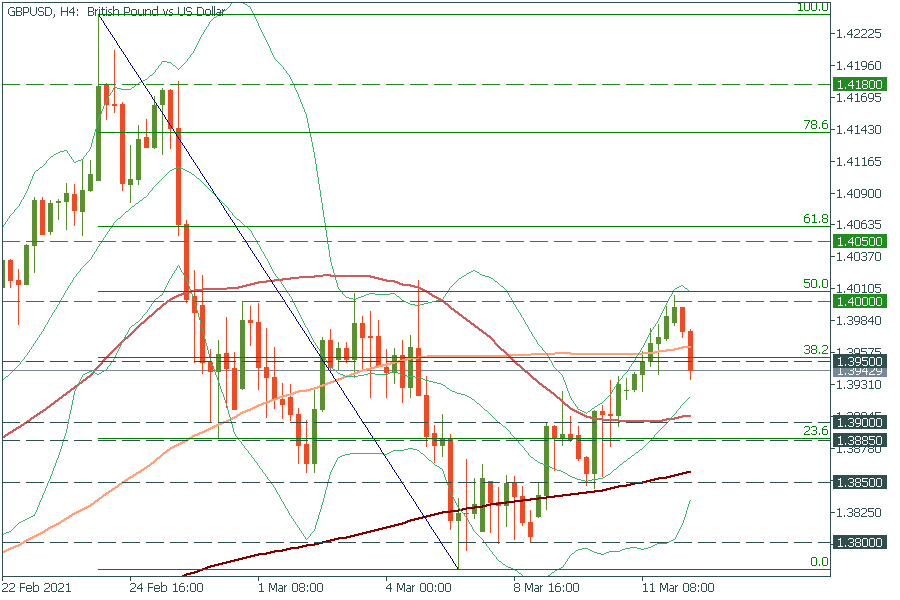
GBP/USD is in a similar situation as EUR/USD. It bounced off the 50.00% Fibo level and the upper line of Bollinger Bands at 1.4000. It has almost broken through the 38.2% Fibo level of 1.3950 and now it’s heading towards the next support area at the 50-period moving average of 1.3900 and the 23.6% Fibo level of 1.3885. It should reverse up near this area.

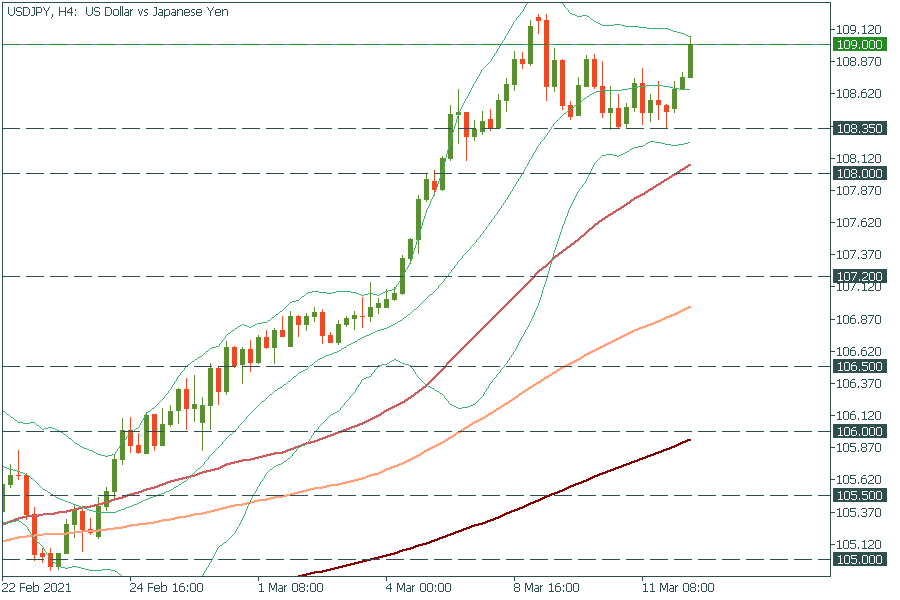
USD/JPY has approached the key psychological mark of 109.00 at the upper line of Bollinger Bands, thus it’s likely to bounce off this level rather than break out as it’s a strong resistance. Support levels are at the recent lows of 108.35 and the 50-period MA at 108.00.

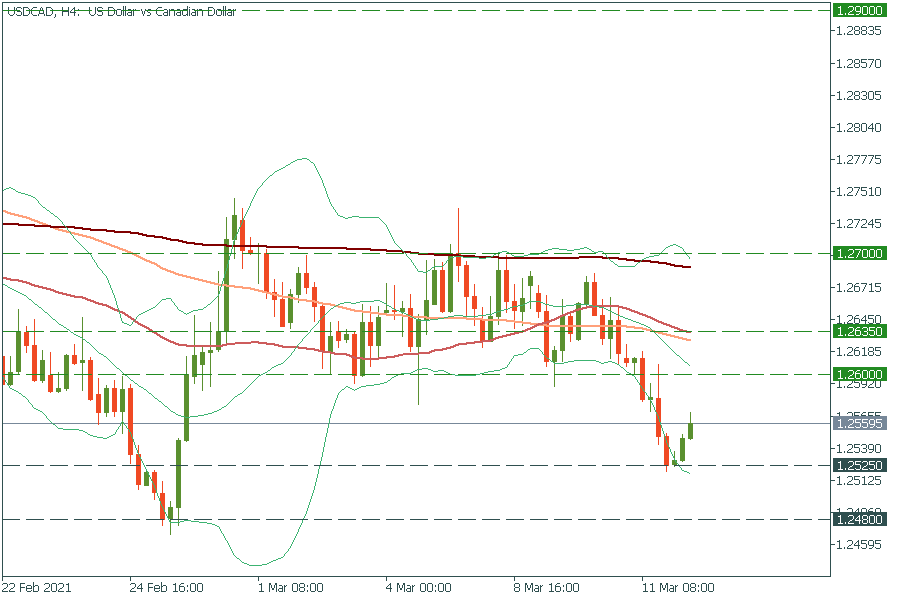
USD/CAD is rising amid the strong greenback. It should rise to the middle line of Bollinger Bands at 1.2600. If it manages to break it, the way up to the 50-period MA of 1.2635 will be clear. Support levels are yesterday’s low of 1.2625 and February’s low of 1.2480. Canada will publish its job data at 15:30 MT time. Follow it as it will add fresh volatility to USD/CAD.
