Trading Accounts
Trading Conditions
Financials
CFD Trading instruments

Don’t waste your time – keep track of how NFP affects the US dollar!
The ASIC policy prohibits us from providing services to clients in your region. Are you already registered with FBS and want to continue working in your Personal area?
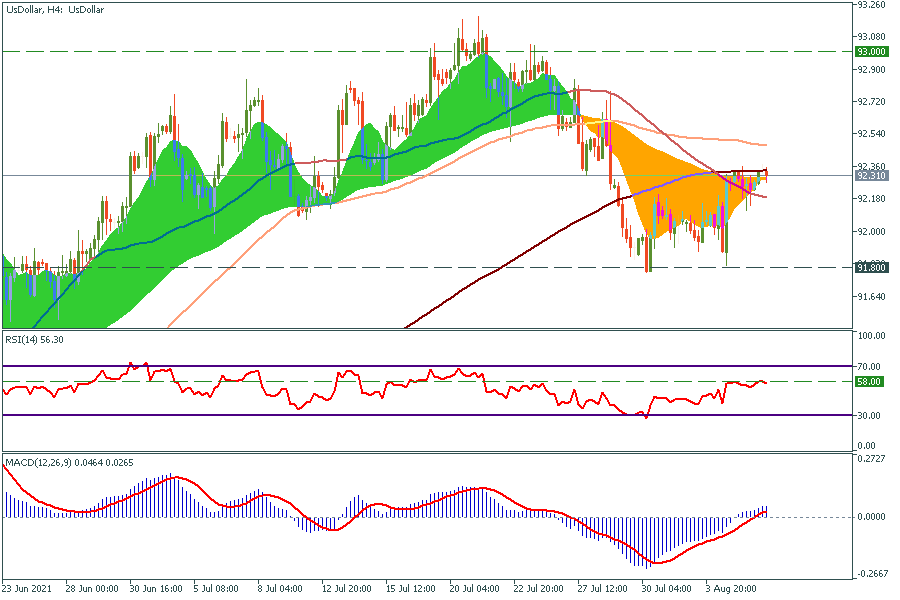
Personal areaUS dollar index tests the 200-period moving average. MA Ribbon indicator shows that the downtrend is almost over. The RSI indicator locates in the middle range and MACD tells the uptrend has just started. In the most likely scenario, after the US Nonfarm Payrolls report, the price will break through moving averages and head towards 93. On the flip side, if it will not, the closest support level is 91.8.
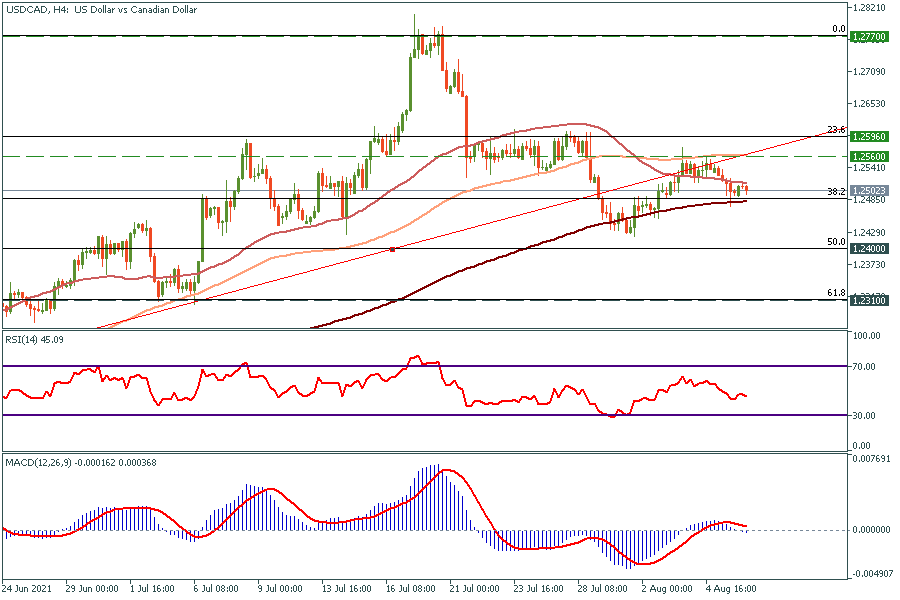
USD/CAD got squeezed between 50 and 200-period moving averages. In case the price holds above the 200-period moving average, it will head towards 1.256 (the 100-period MA) and 1.2596 (Fibonacci 23.6). In another scenario, it will meet 1.24 and 1.231 as these are 50 and 61.8 Fibonacci levels respectively.
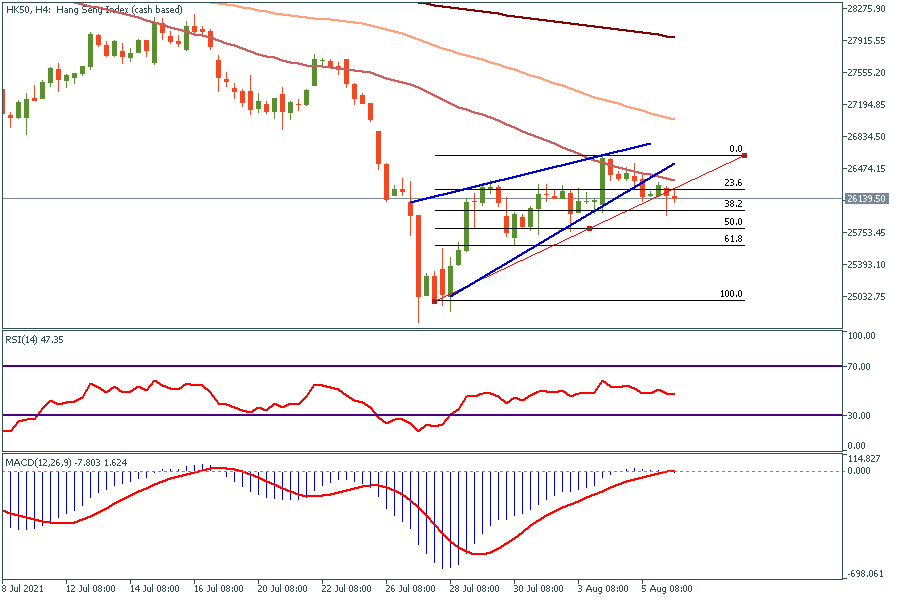
HK50. The price has fallen out of the rising wedge and now it is consolidating between 26,240 and 25,980, which are 23.6 and 38.2 Fibonacci levels respectively. It seems that the 38.2 Fibonacci is an extremely important support level as the price could not break it through for 3 times since August 3. That is why we suggest thinking about long trades if the price meets this level again. In this case, targets will be 26,240 and 26,600. Unfortunately, if HK50 breaks the 38.2 Fibonacci level, it might fall to 25,000 and draw a “double bottom” pattern.
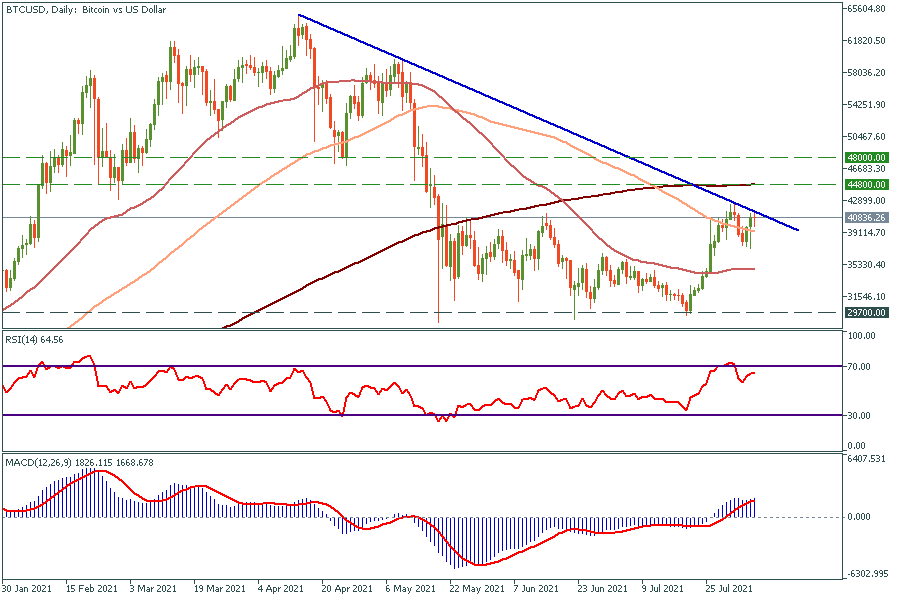
The main question for Bitcoin at the moment is: “Can it break through the blue resistance line?” If it does, the bull-market run will happen and the price will skyrocket up to $44,800 and $48,000. Otherwise, the middle-term target will be $29,700.