Trading Accounts
Trading Conditions
Financials
CFD Trading instruments

Don’t waste your time – keep track of how NFP affects the US dollar!
The ASIC policy prohibits us from providing services to clients in your region. Are you already registered with FBS and want to continue working in your Personal area?
Personal areaThis article will introduce one of the most powerful market concepts – retracement – and show how to operate it at full potential. Retracement is a temporary price movement against the established trend. Why is it so important for a trader? Retracement levels are ideal for defining where to enter the market safely and place a Stop Loss order to minimize possible risks. Seems to be really useful, right? Let’s find out together!
We will start with the benefits and then move on to the drawbacks. The most significant advantage is that a trader usually gets a higher chance to predict the next price movement if he notices a strong market signal at a level following a retracement. Prices tend to return to the “mean” or “average” levels. Therefore, when your eye catches a retracement or rotation, look for an entry point. Elsewhere, it allows a trader to put proper Stop Losses, which may be perfect to avoid bigger losses and at the same time not to be knocked out by sudden volatility. It would be so annoying, if your prediction was right at the beginning, but putting a wrong Stop Loss got you out of the market. In addition, using retracement allows having better risk/reward ratios. Generally, if a trader puts a 200-pip target, they will likely place a 100-pip stop. However, if you know the exact level of retracement, you may set a tighter Stop Loss. For example, the previous levels may be transformed into a 250-pip target with a 50-pip stop.
You should be aware of some disadvantages. However, in this case, the positive sides outweigh the negative ones. Firstly, you can miss some nice trades as you are supposed to wait for the retracement. It is not so terrible as you don’t actually lose anything. Secondly, you’ll have fewer opportunities to open a trade as prices don’t retrace so many times. Finally, retracement trading requires patience, but even if you don’t have it, it’s a good way to develop this personal trait, which is important for every trader.
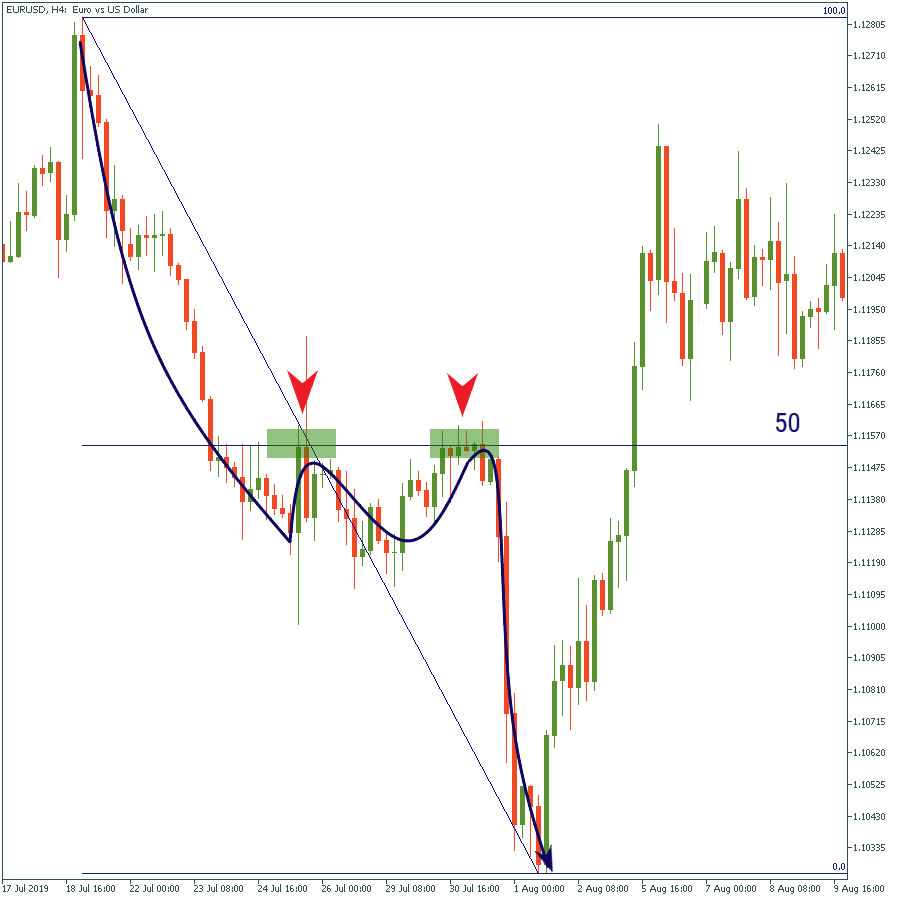
Retracement to a key level creates the optimal situation to enter the market. In the picture below you can notice that the price has pulled back to the key level after a brief push above it. There was no other clear market signal that the price will go down, so this level can be sometimes the only hint for a trader, that’s why it’s significant not to miss it.
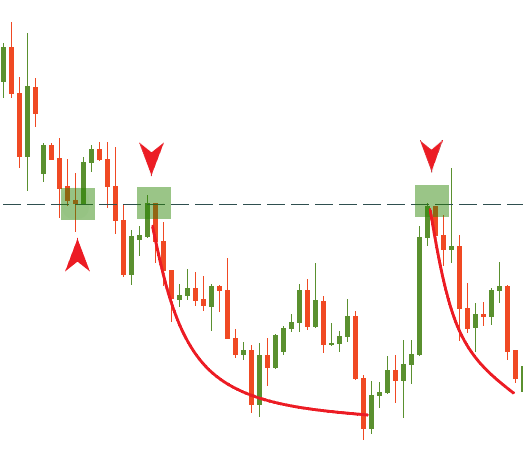
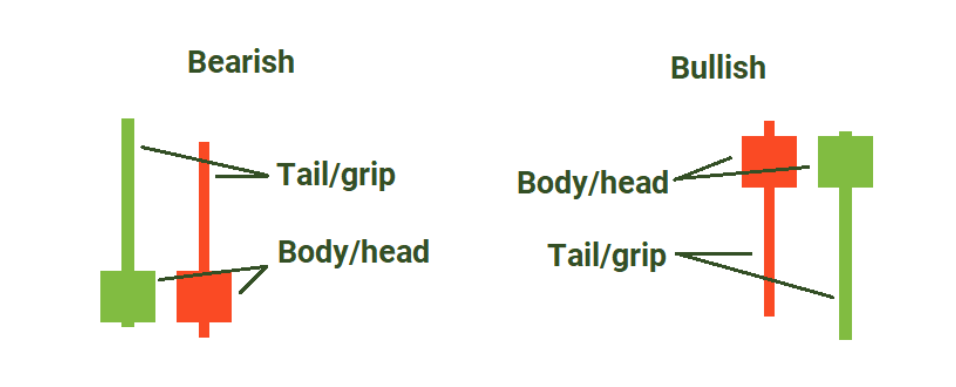
The best scenario is when the price pulls back to a retracement level and then forms a pin bar or a hammer candlestick (the one with the long tail and small body). The combination of a few retracements to a key level and a pin bar signal generates the best conditions for a market entry.
*If the body of a pin bar is in the upper part of the candlestick – it’s a bullish sign, and a precursor of an upward reversal if there was a downtrend.
If the body of a pin bar is in the lower part of the candlestick – it’s a bearish sign, and it often precedes a downward reversal if there was an uptrend.
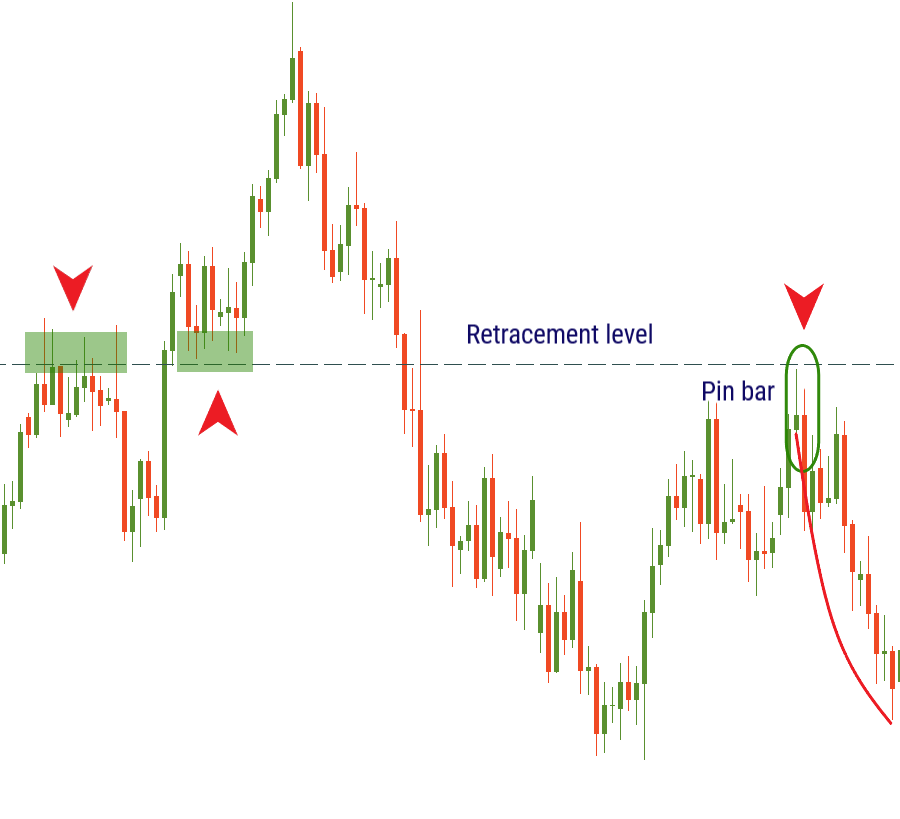
When a retracement mixes with another price signal, it allows a trader to catch the right move with a higher possibility.
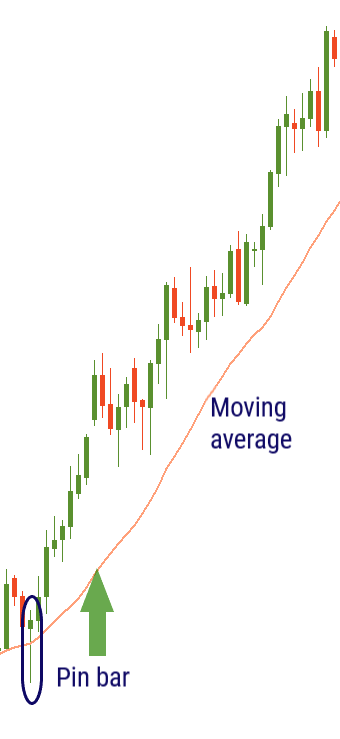
Retracement really doesn’t have to be a horizontal level, it easily can be a moving average. As mentioned above, prices tend to return to the “mean” or “average” levels. That’s why, if the price retraces to a moving average, you should wait for it to form a signal, and that would be the right moment to enter the market.
According to statistics, most of the time the price tends to retrace 50% of its major movement. Therefore, it’s a nice strategy to wait for a pullback to the 50% Fibo level as after touching the price generally sticks to its initial price direction again.
*To apply a Fibonacci level to your charts in MetaTrader, you need to click “Insert” button of the menu and then choose “Fibonacci”.
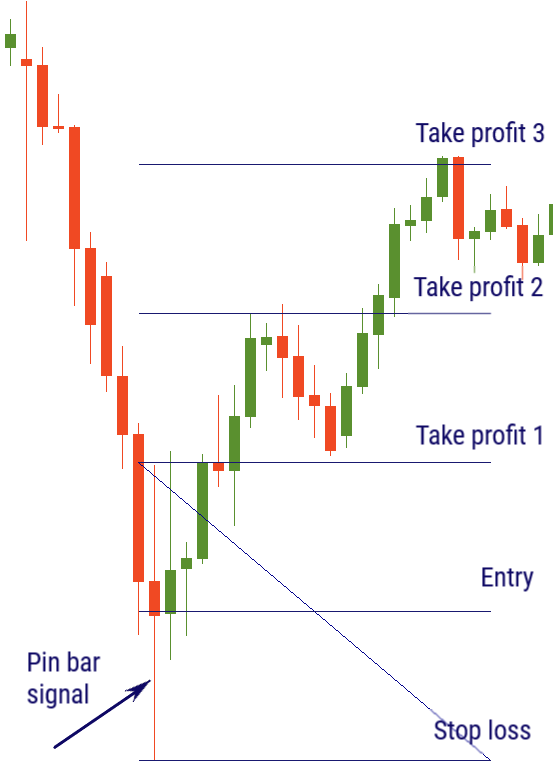
It may be surprising, but you can use just one candlestick to draw retracement levels, which would actually work. When you notice a longer-tailed pin bar or a hammer candlestick on the chart, you may consider entering the market at the level of half of the bar’s body, also put the Stop Loss at the candle’s low, and then place the first Take Profit at the bar’s high and then the second and the third Take profits – further at equal intervals.
*To measure the half of the body and intervals you can use an already familiar tool – a Fibonacci retracement, and then just modify some levels to 0.5, 1.0, 1.5 and etc.
Great! We have discussed the most significant cases with retracement. Now it’s time to practice! Go to MetaTrader and check out your new skills!