Trading Accounts
Trading Conditions
Financials
CFD Trading instruments

Don’t waste your time – keep track of how NFP affects the US dollar!
The ASIC policy prohibits us from providing services to clients in your region. Are you already registered with FBS and want to continue working in your Personal area?
Personal areaThe price never follows straight lines. Usually, price movements can be described as so-called price waves. During the strong trend, every next high must be higher than the previous one and every next low should be higher than the previous one as well.
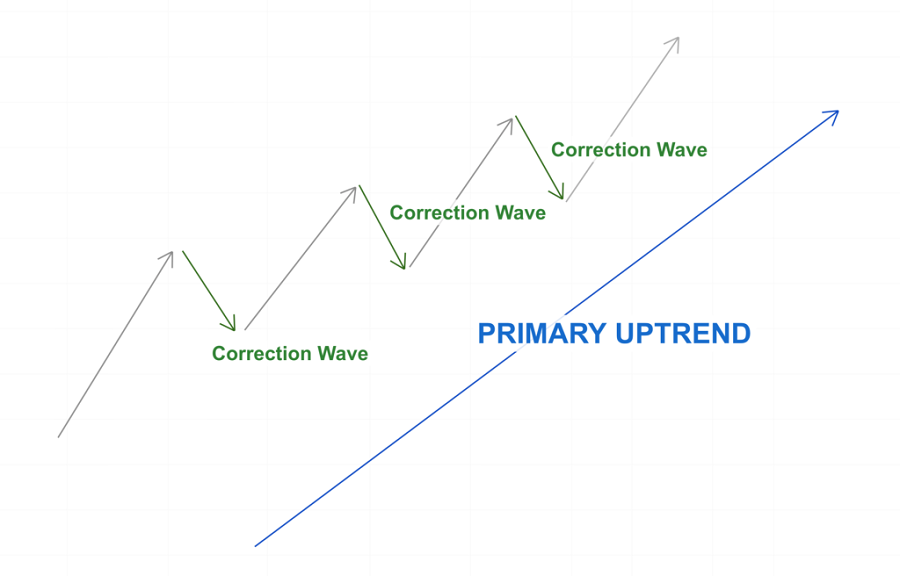
In the picture above a perfect example of the bullish trend is presented. As you can see there are three correction waves, which allow traders to enter the strong bullish market.
In this article, we will discuss how to pick the best point to enter the market during the correction.
Trend lines are the best trading instrument of all time. Even traders who swear off indicators draw them.
Generally speaking, a weak pullback points to trend strength. Vice versa, bigger pullback signals upcoming trend reversal.
John Hill, a famous trading writer, created the trend theory. This theory is simple, a trader needs to draw only two trend signal lines to define the trend power.
First, you need to learn how to draw signal lines.
Connect 0 and 4, 0 and 2.
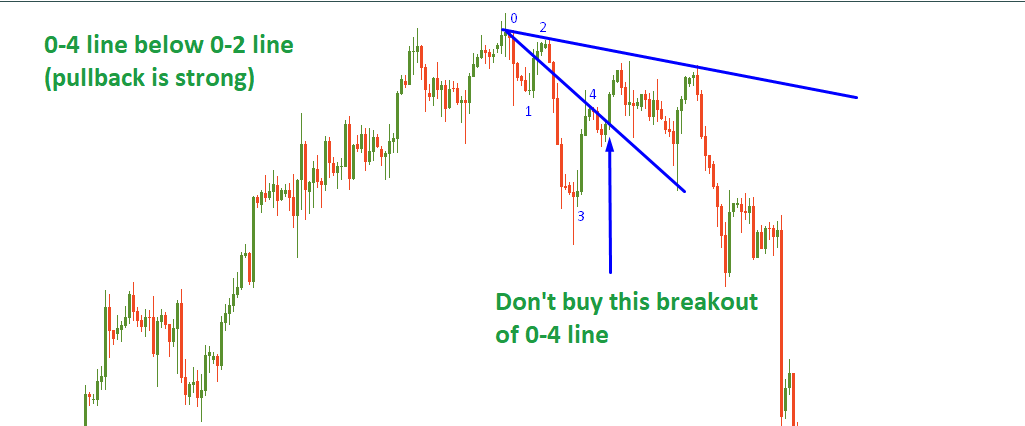
If during bullish trend the 0-4 line is steeper, the pullback has power. Avoid trading this pullback.
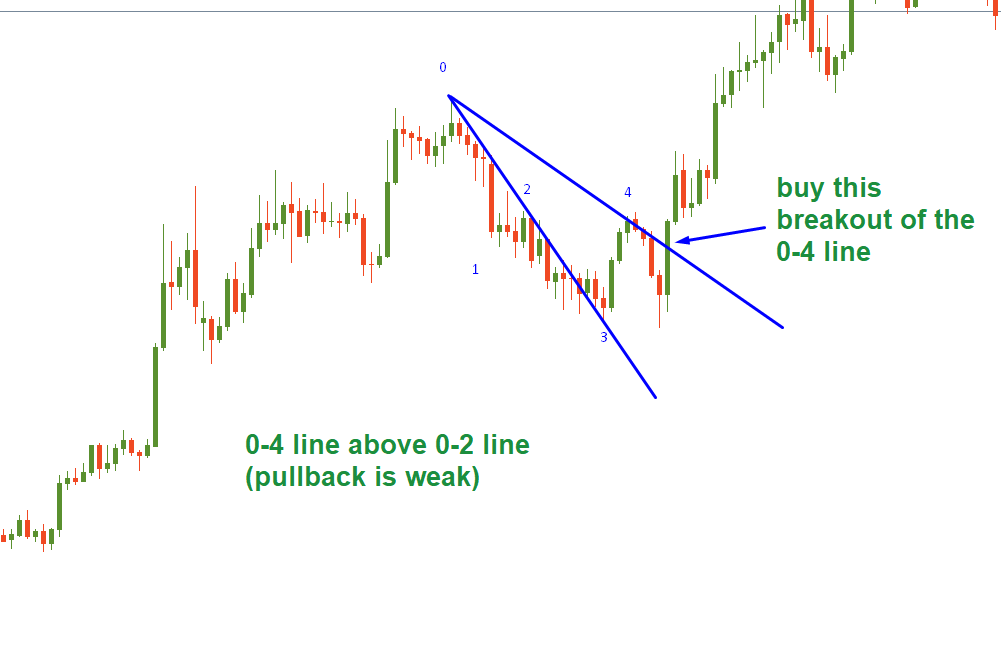
If during a bullish trend the 0-2 line is steeper, the pullback has no power. You might open a long trade as presented in the picture (when price breaks through the 0-4 line).
You might use this example during downtrends as well.
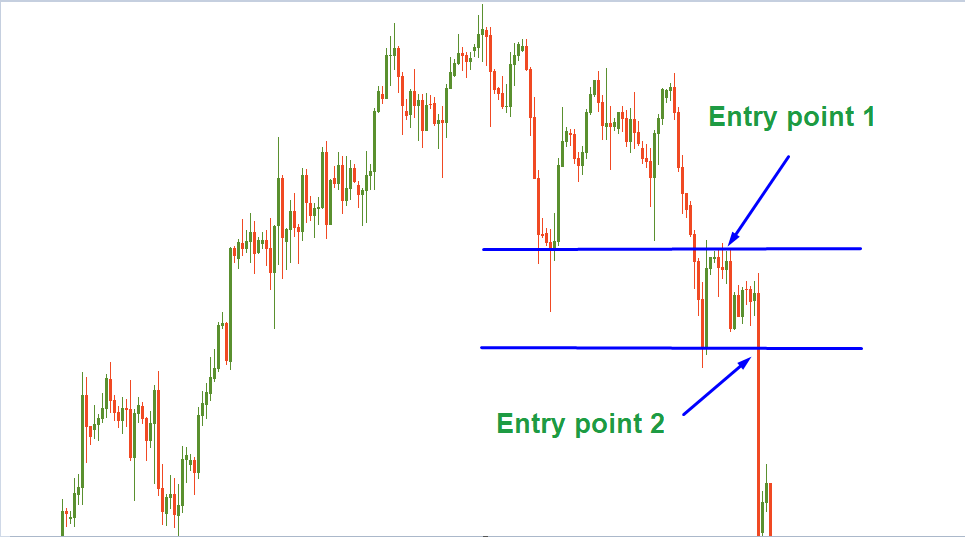
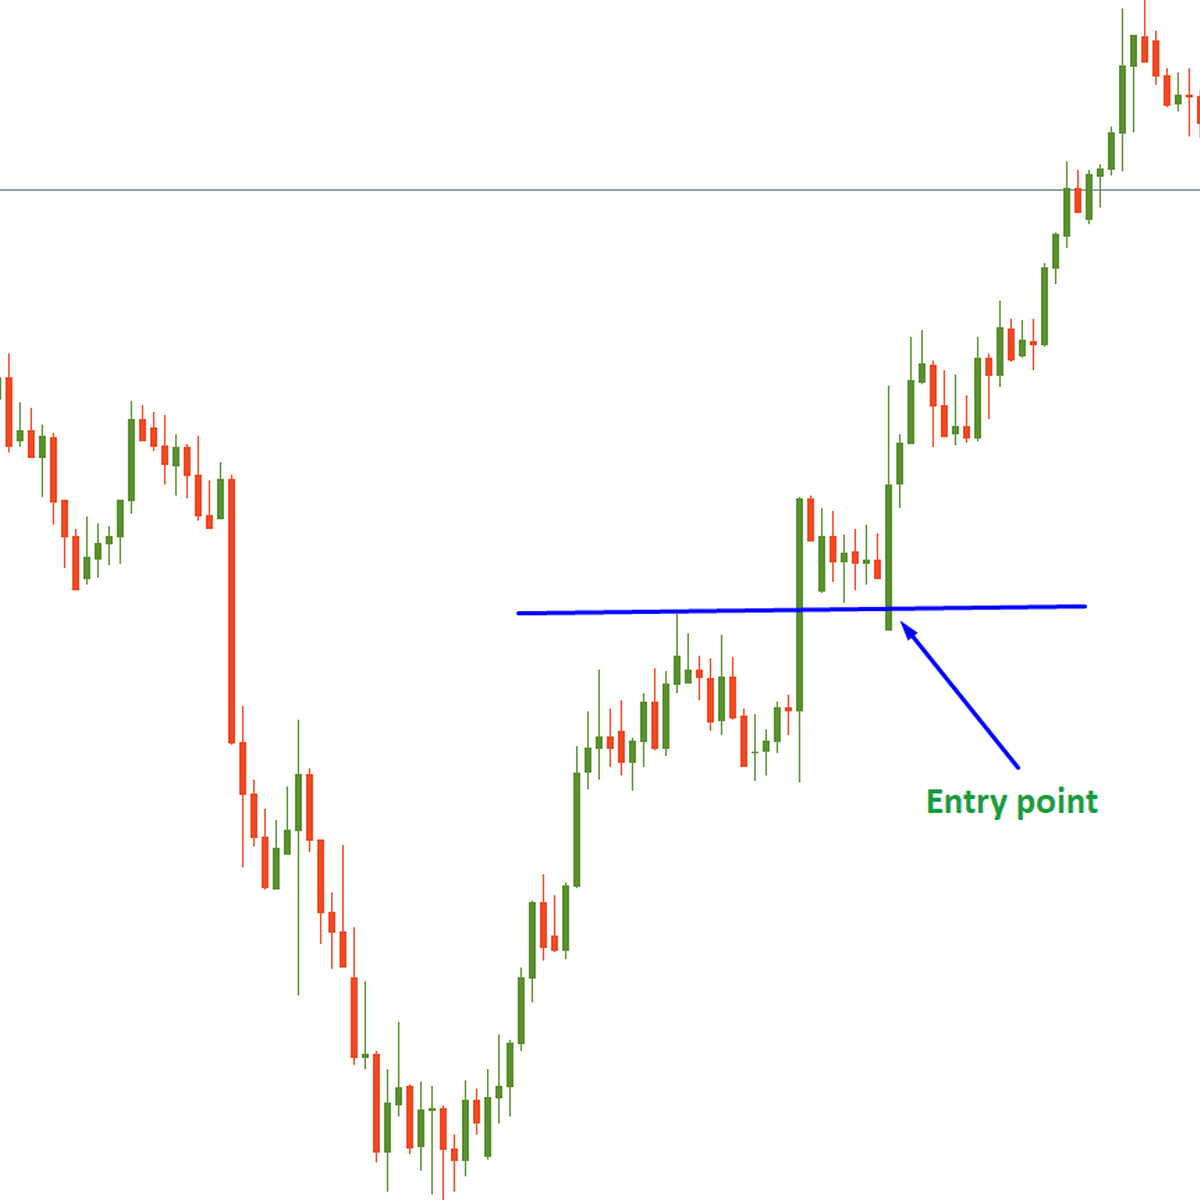
Breakout pullback is one of the most popular pullback strategies. This strategy is the most effective at the market turning points. During the strong trend, a price might consolidate in the channel and form support and resistance levels.
In the picture, you can see that the price broke through the first support level (upper blue line) and retested it from the below (after a breakout, the price usually returns to the level which has been broken through). In the moment of retest, an aggressive trader might open a short trade. In this case, the potential reward/risk ratio is highest because the price may get above the level and continue the uptrend.
The conservative trader should wait until the price continues the trend structure and breaks into a new low (lower blue line breakthrough). That is the second sell entry point. The conservative entry happens later and, therefore, the potential reward/risk ratio is also smaller.
During trend movement, the price always pulls back to accumulate powers for the next moves. Usually, the price returns to the previous high/low level and tests it from above/below during a bullish/bearish trend respectively. This pullback might be considered as an opportunity to find an alternative entry point for those who missed the initial entry opportunity.
Furthermore, a trader could also choose to use the stepping pattern to pull the stop loss behind the trend in a safer way. In this case, the trader waits until the price has completed a step in the direction of a trend and then pulls the stop loss behind the last pullback area. The trailing stop loss is then safely protected and not as vulnerable.
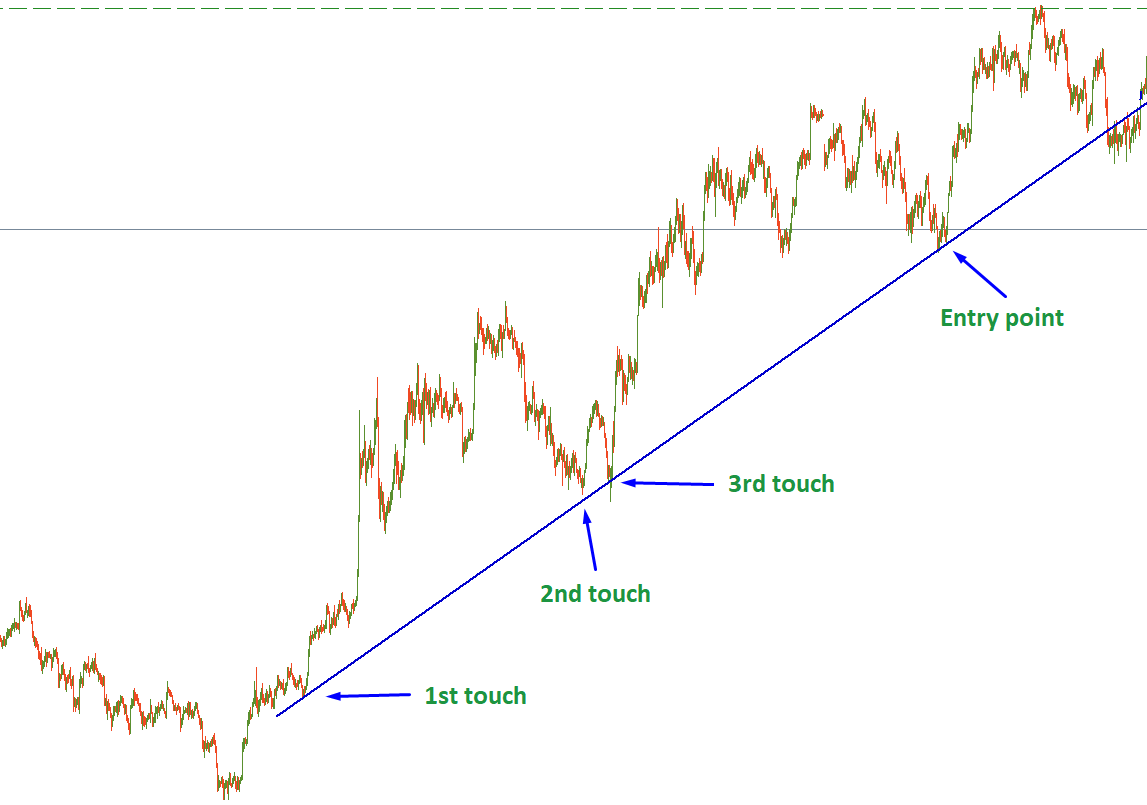
This is another famous method of trading pullbacks. The drawback is that trendlines often take longer to be validated. You can always connect two points, but trendline requires at least three touches. That’s why you can trade trend line pullback only at the 4th or 5th touch.
It is a good additional method, but as a standalone method, the trader may miss many opportunities.
In this article, we have discussed 4 strategies to trade pullbacks during an ongoing trend.
The first three strategies can be used separately, while the trendline is an additional option that can improve any of the presented strategies.