Trading Accounts
Trading Conditions
Financials
CFD Trading instruments

Don’t waste your time – keep track of how NFP affects the US dollar!
The ASIC policy prohibits us from providing services to clients in your region. Are you already registered with FBS and want to continue working in your Personal area?
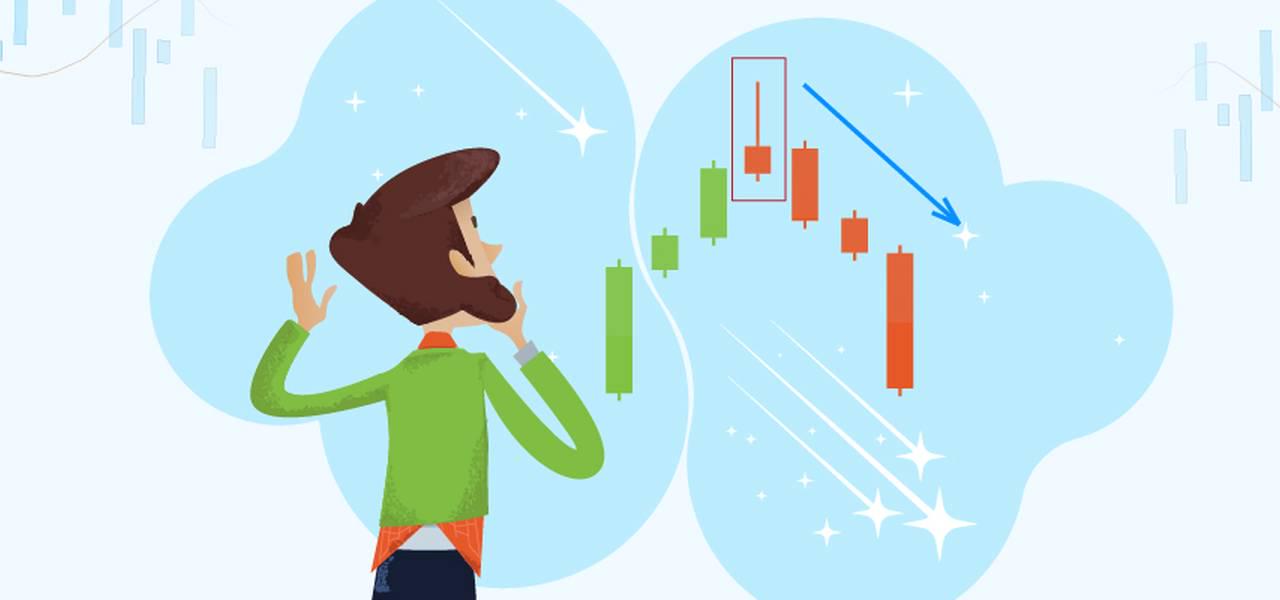
Personal areaA shooting star pattern is really popular among traders because of its simplicity and effectiveness. Elsewhere, this pattern has a significant advantage – it occurs on the charts quite often, so it won’t take too much time to find it. In this article, we will discuss what the shooting star pattern is, how to recognize it, and how you can use it in your trading. Let’s get started!
Look at the picture below – it is the shooting star!
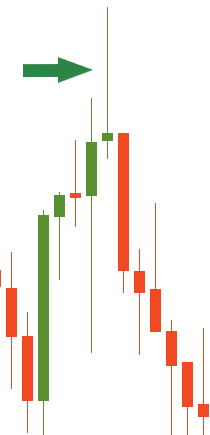
A candlestick roughly represents the tug-of-war between buyers and sellers. If a candlestick grows up, it means that there are more buyers or bulls on the market. Therefore, the price rises. On the flip side, if a candlestick goes down, there are more sellers or bears on the market. As a result, the price moves downward.
The long upper tail of a shooting star shows that bulls (buyers) were trying to push the price higher, but by the end of the session more bears (sellers) appeared, and they pulled the price lower. In other words, higher prices were rejected, so the price moved down. That’s why the price is likely to go down in the next session as well.
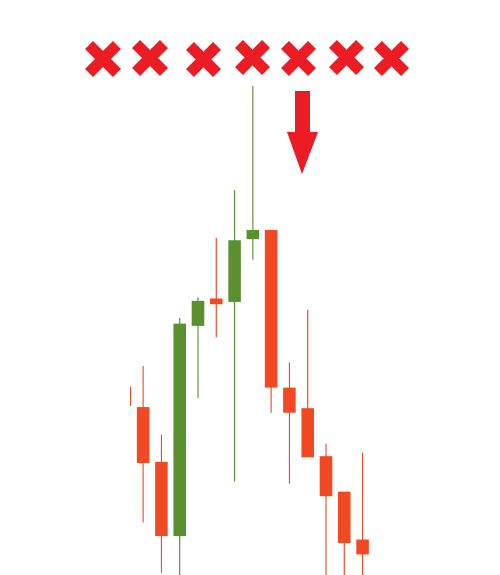
Great! You’ve learned what a shooting star is and how to identify it. Now the time to know how to use it! There is a simple trading strategy. First of all, you open the chart and try to find a shooting star. Once you’ve noticed the formation of the shooting star, you should wait for the next candlestick to move below the low of the shooting star you’ve just found. You need to do that to make sure the candlestick pattern confirms itself. The perfect market entry will be exactly at the time when this confirmation happens. You can use a sell stop entry to do this automatically.
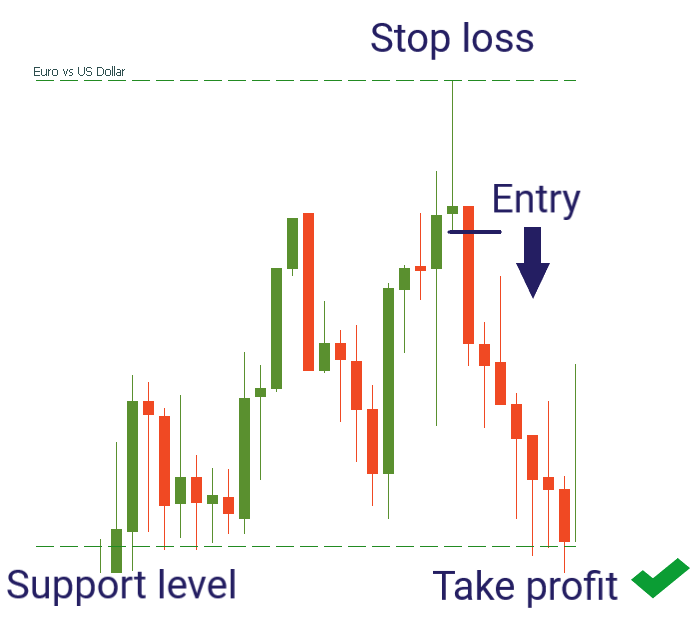
Let’s try this strategy on the EUR/USD chart.
Awesome! You’ve just leveled up your trading skills! Try it in Demo Account.