Trading Accounts
Trading Conditions
Financials
CFD Trading instruments

Don’t waste your time – keep track of how NFP affects the US dollar!
The ASIC policy prohibits us from providing services to clients in your region. Are you already registered with FBS and want to continue working in your Personal area?
Personal areaWhen you give a first glance at the Ichimoku indicator, it may hurt your eye. Just take a look at the picture below.
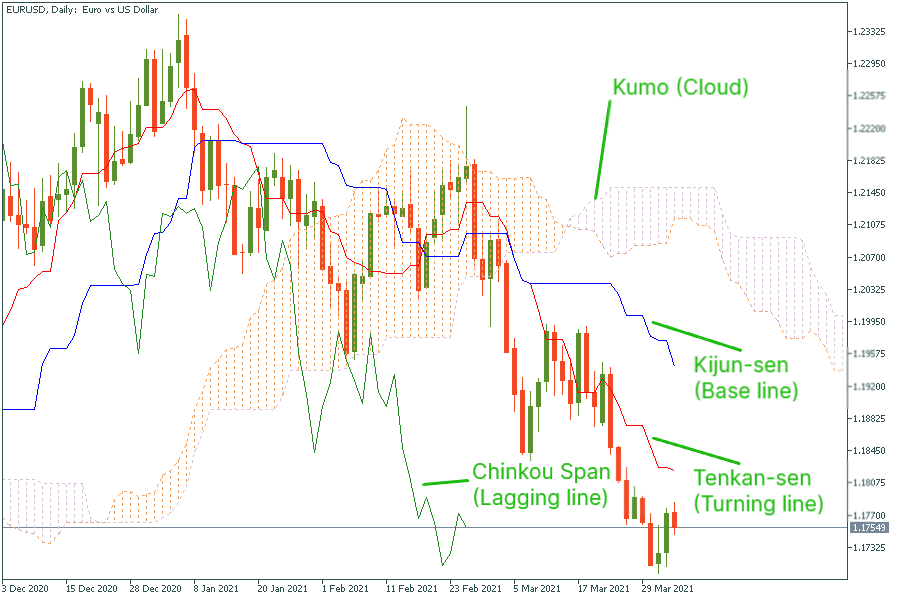
Let these sharp lines and stripes not scare you! In this article, we will teach you how to use this complicated tool for your successful trading decisions.
Ichimoku Kinko Hyo (Ichimoku) is a complex and very informative technical indicator. In Japanese, it means a “glance at a chart in equilibrium”. In this article, we will provide a brief explanation of indicator’s purposes and elements needed for our strategy. If you want to go into the depth of trading with Ichimoku, we recommend you to visit the FBS Guidebook.
There are five main parts of the Ichimoku indicator.
What Ichimoku is useful for?
Ichimoku is great when you need to identify the direction and the strength of a trend. It also helps to set support and resistance levels. Most importantly for us, Ichimoku can be used for building an effective trading system.
For the strategy we are going to explain below, we need the Stochastic Oscillator with customized settings that will be used as a filter.
Timeframe: daily
Currency pairs: majors
Indicators: Ichimoku (default);
Stochastic oscillator with the following settings:
%K period = 5; %D period = 3; Slowing = 3.
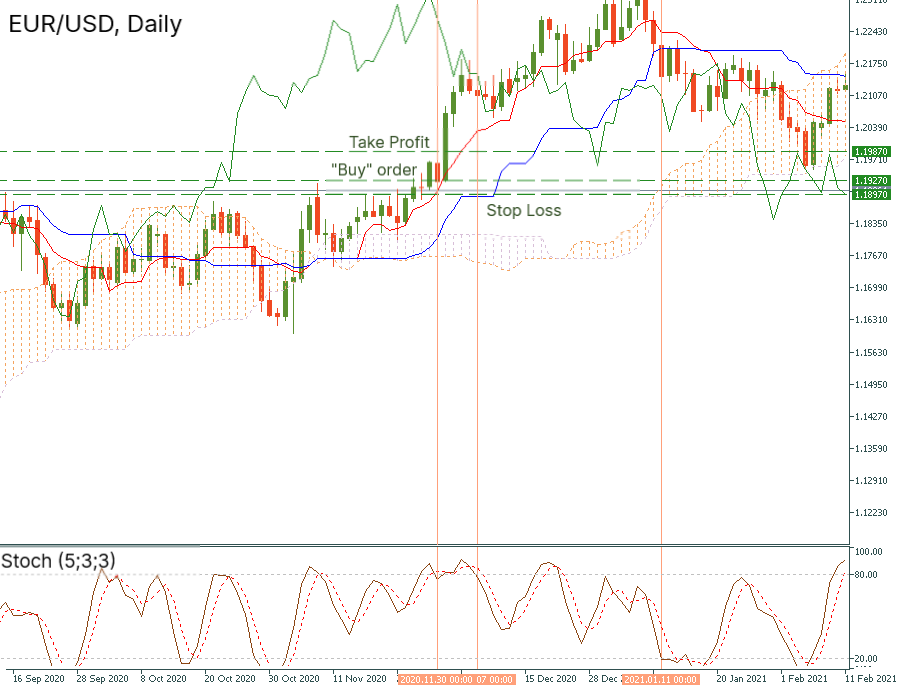
Example: On the daily chart of EUR/USD, the price was trading above the Kijun-sen and the cloud. On November 30, the stochastic oscillator crossed in the overbought zone. We opened the long trade at the opening price of the next candlestick at 1.1927. The Stop Loss was placed at 1.1897, 30 pips below the opening price. The Take Profit was located at 1.1987 (60 pips above the initial order).
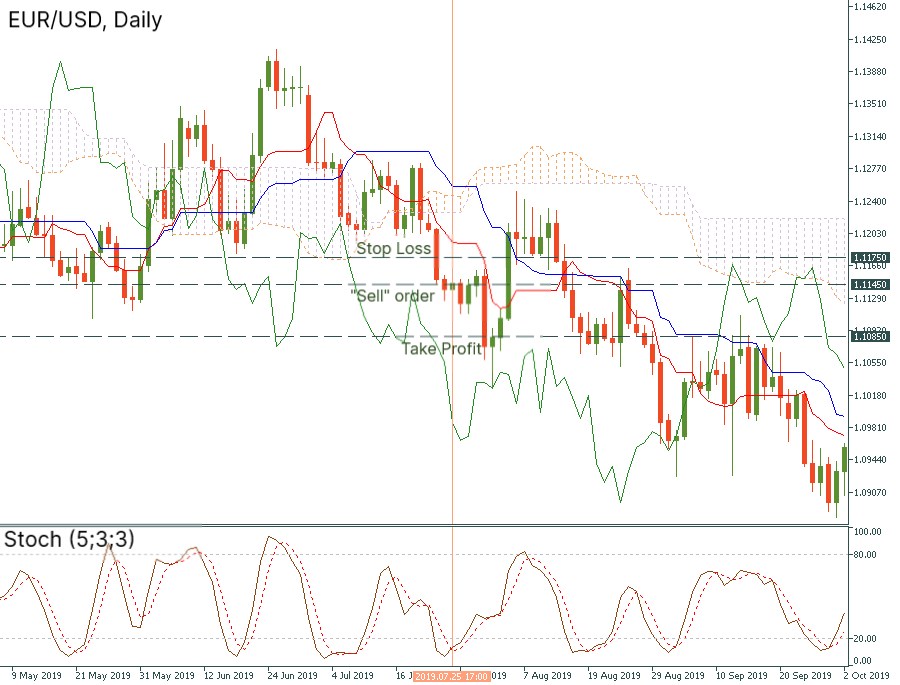
Example: On the same daily chart of EUR/USD, the price was moving below the blue line of Ichimoku and the cloud. On July 25, the stochastic oscillator crossed in the oversold zone. We placed a sell order at the opening price of the next candlestick. This is the 1.1145 level. We locate the Stop Loss at 1.1175 (30 pips above the entry), while Take Profit goes at 1.1085 (60 pips below the entry).
As we can see, with the strategy above the Ichimoku indicator looks less horrifying for a novice trader. The lines can show you the right direction of a trend and, in fact, “predict” further momentum.