Trading Accounts
Trading Conditions
Financials
CFD Trading instruments

Don’t waste your time – keep track of how NFP affects the US dollar!
The ASIC policy prohibits us from providing services to clients in your region. Are you already registered with FBS and want to continue working in your Personal area?
Personal areaIn this article, we will discuss what the term confluence means and why traders should care about it.
Originally, the word ‘confluence’ means a place where two or more rivers come together to form a single water flow. In Forex, confluence refers to a situation when several technical tools give the same trade signal. Most of the time these are technical indicators, though sometimes they may be price patterns or price action. For this reason, some traders fill their charts with lots of indicators as they want to catch the desired confluence. However, often the result is conflicting signals, which confuses a trader. How to avoid the chart’s overloading? Use two or three indicators, that would be enough!
There is no strict classification of confluence. You are free to combine any technical tools you want. Only one thing is important: choose indicators that are independent of each other, in other words, not calculated using each other. Otherwise, you would risk finding a fake confluence, which may mislead you. Let’s discuss some good examples of using confluence.
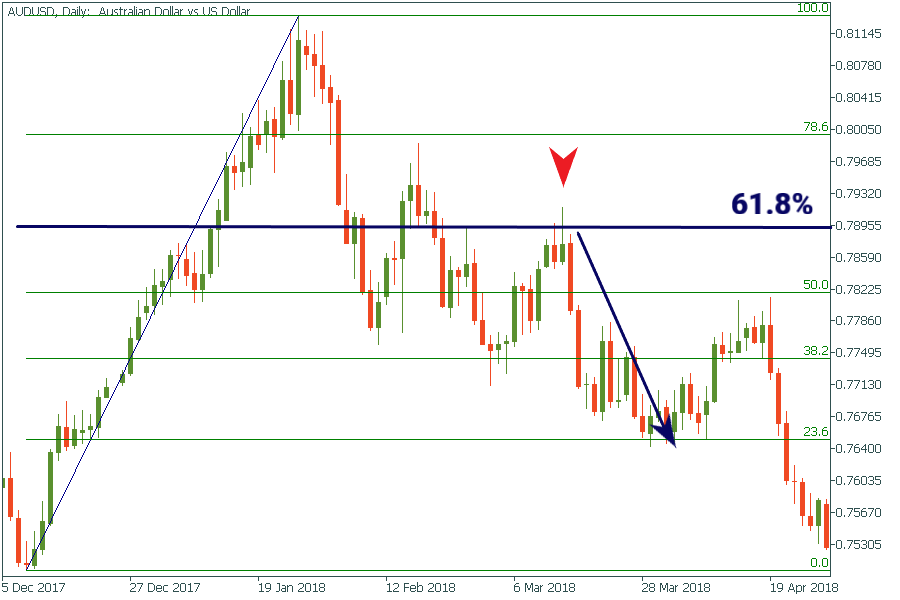
On the chart below you can observe a typical confluence: a shooting star in combination with the Fibonacci retracement. A shooting star is a candlestick with a long upper shadow and a little lower shadow, which gives a bearish signal. The 61.8% Fibonacci retracement level acts like a resistance, which stops the price from further rising. As a result, the price has reversed from this level and started falling.
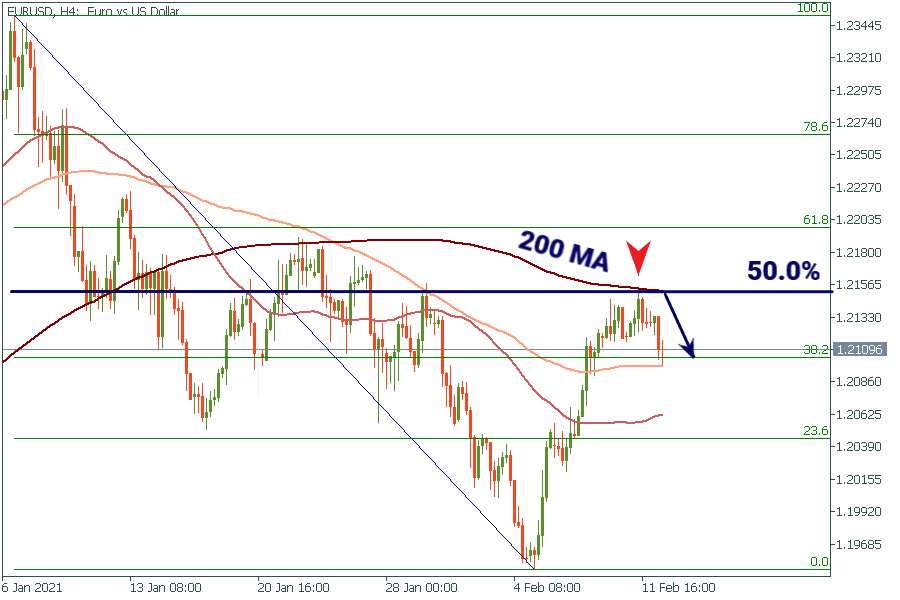
Here’s another example: the 200-period moving average coincides with the 50.0% Fibonacci retracement level. After the long rally up, the price bounces off the strong resistance at the intersection of the moving average with the Fibo level and starts falling.
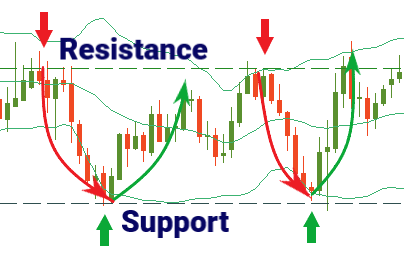
It’s a good idea to use the combination of Bollinger Bands (BB) with support and resistance levels. The BB indicator consists of 3 lines – a middle band and two outer ones.
When the price reaches the upper band, the asset is considered overbought. And if the upper line of BB coincides with the resistance level, the way down is likely to happen.
When a price approaches the lower band, the asset is trading at a relatively low price and is considered oversold. And if the lower line of BB coincides with the support level, the way up is likely to happen.
A confluence is a great tool for every trader. It’s based on the classic Forex principle: don’t rely only on one indicator, but at the same time, don’t overload your chart with dozens of indicators. This is essential in Forex to avoid fakeouts and unexpected reversals. In fact, most trading strategies are built on the concept of confluence. If you have not created yet your strategy, this is how you can start building it now from scratch!