
Trading Accounts
Trading Conditions
Financials
CFD Trading instruments

Don’t waste your time – keep track of how NFP affects the US dollar!
The ASIC policy prohibits us from providing services to clients in your region. Are you already registered with FBS and want to continue working in your Personal area?
Personal areaInformation is not investment advice
The main purpose of using Fibo retracement levels is to determine the potential correction size against the main trend.
To apply Fibo retracement to a chart, you need to do the following:
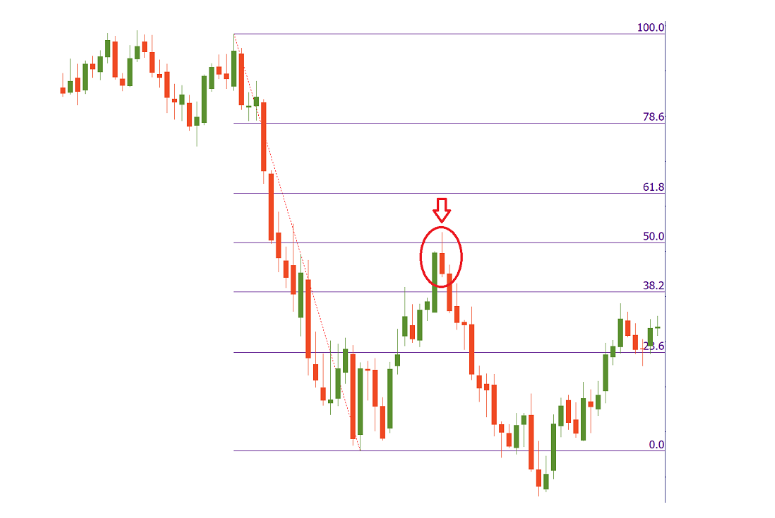
Then 6 horizontal lines will automatically appear intersecting the trend line at Fibonacci levels of 0.0%, 23.6%, 38.2%, 50%, 61.8%, 100% (Fibonacci ratios as described above). Additional horizontal lines will be drawn at 161.8%, 261.8%, and 423.6%.
Notice that you can add other levels, for example, 78.6% in the tool’s settings.
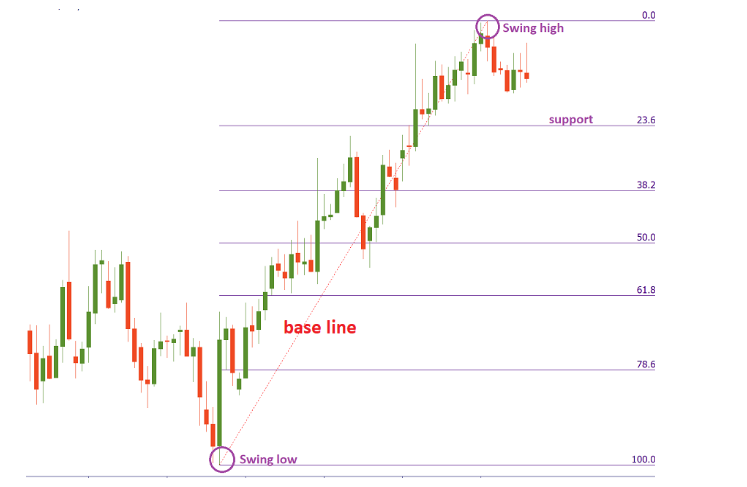
The resulting Fibonacci levels act as support and resistance: prices tend to consolidate near these levels before the correction either ends (and the overall trend resumes) or continues (the price breaks one of the retracement levels and moves to the next one, for example, to 50% after the 38.2% level). If the price retraces more than 61.8% of the previous move (on a closing basis), the odds are that it will reach the beginning of the trend. The 50% retracement level is the most widely monitored retracement level and is a common area to buy during a retracement of an uptrend or sell if it’s a retracement of a downtrend.
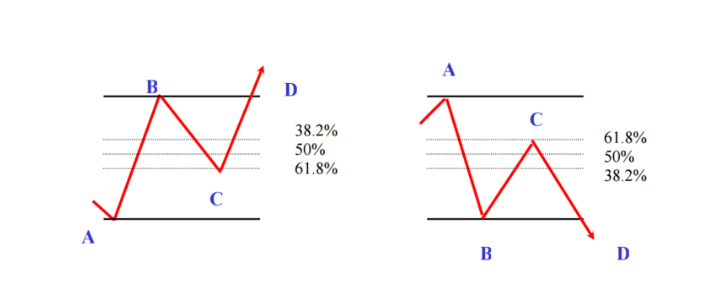
There are two ways to trade using the Fibo retracement tool:
1. Aggressive
To trade at every Fibo level. If the market started actively correcting, one opens positions against the trend, targeting the next Fibo level.
2. Conservative
Wait for the prices to recoil from the Fibo level in the direction of the main trend.
The price doesn’t always stop exactly at the Fibo level. In most cases, Fibo points at the area of support/resistance. As a result, before you open a trade in point C, wait for a confirmation that the price has indeed resumed the primary trend.
You may use Fibonacci on different timeframes. If Fibo levels on different timeframes converge, these levels become more important.
You need to understand that Fibonacci levels are designed to give you a clue about the most profitable entry/exit points, but they don’t guarantee a positive outcome. In order to increase your chances for a successful trade, use the Fibonacci retracement tool together with other technical indicators to achieve a higher probability of success.
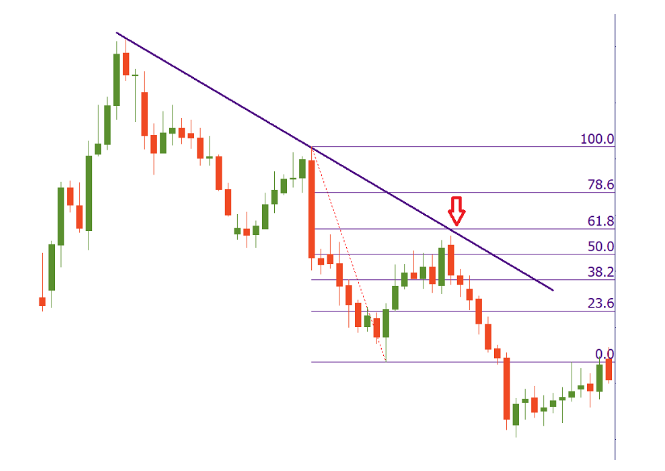
First of all, consider using Fibos with trendlines. Draw a trendline and then plot Fibo retracement. At the point of intersection of these two tools, you might find the most favorable entry point.
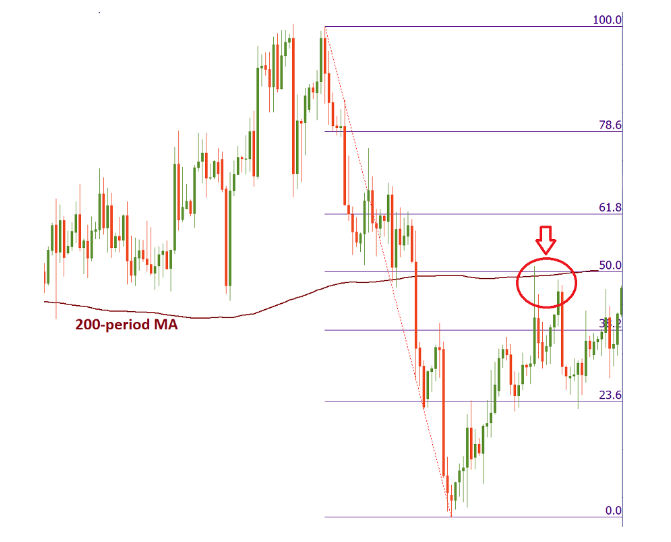
If the 200-period moving average coincides with 50% Fibonacci retracement, this level will likely be able to hold the initial attack on the market. This is a good place for taking profit or entering the market in the direction of the main trend.
You can also combine the Fibo retracement tool with candlestick patterns. Any reversal candlestick pattern next to a Fibonacci level will likely mean that the price action is going to take a new direction.
Finally, Fibonacci retracement can provide you not only with correction levels but also with some targets. If the price retraces 100% of the previous trend and breaks the 100% level, you can use 161.8% Fibo as the next target. The levels provided by the Fibonacci retracement tool that exceed 100% are called Fibonacci ‘extension’ levels.

