
Trading Accounts
Trading Conditions
Financials
CFD Trading instruments

Don’t waste your time – keep track of how NFP affects the US dollar!
The ASIC policy prohibits us from providing services to clients in your region. Are you already registered with FBS and want to continue working in your Personal area?
Personal areaInformation is not investment advice
Moving Average is one of the widely used indicators in trading. Traders love it because of its simplicity and effectiveness.
In this article, we will explain what this indicator is and how to use it to lift your profit.
Moving average is the trend indicator. It takes average price figures and as a result, smooth price actions from fluctuations.
There are 4 main types of the Moving Average that you can implement in MetaTrader. We won’t give you complicated formulas. It’s more important for you to understand the idea of each type.
Usually, traders use the Simple Moving Average. This type of the MAs shows the average of close prices for the period it considers. As a result, all prices are equal in value.For example, if we have 10-day MA, we calculate a sum of 10 close prices and divide it in 10. Every time a new close price forms, the oldest one isn’t counted anymore.
Exponential MA and Linear Weighted MA are quite similar. They calculate the latest prices with the higher coefficient. As a result, these MAs reflect price’s moves the most and gives signals faster. Be careful! These MAs give fast signals but some of them may be fake.
Smoothed MA is based on the Simple MA. It’s easy to define its major function after the first glance at its name. This MA clears price moves from fluctuations the most. This MA is the best to define the trend.
MA is set in MetaTrader, so you don’t need to download it. Go to “insert” – find “indicators” – go to “trend” – and you will see the Moving Average. It’s more important to apply correct settings.
A period is the number of candlesticks that will be taken into consideration for calculating. The bigger period is, the smoother MA and more accurate signals will be. The smaller the period, the closer the MA will be to the price.
There is no single rule what period of the MA to use. Analyzing charts with big timeframes, traders prefer MAs with such periods as 50, 100, and 200. To trade on smaller timeframes, investors prefer small periods such as 9, 12, and 26.
There are several options. It can be close, open, high, low, median, typical and weighed close prices. However, usually, traders use the close price.
This setting is used to pull the indicator forth and back in time. As a result, the MA will move up or down.
One thing we need to tell you. MAs give delayed signals because they calculate the last close price. Take it into consideration while using them in your trading.
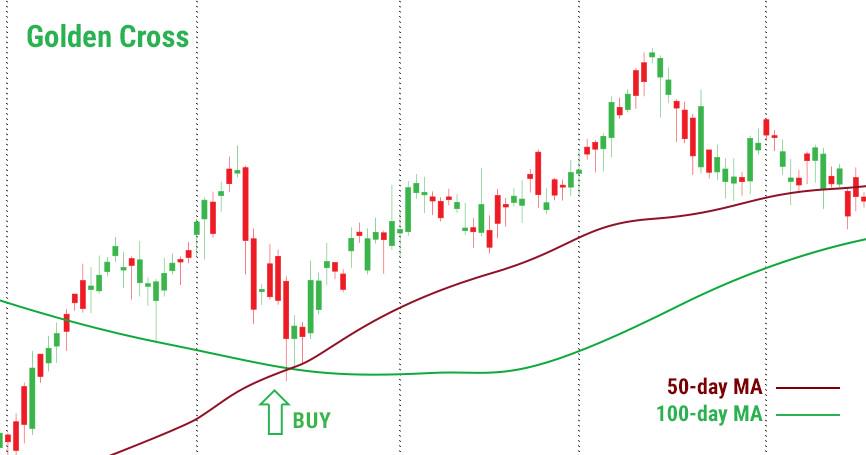
Golden cross
When an MA with a smaller period crosses an MA with a bigger period bottom up, it’s a signal to buy.
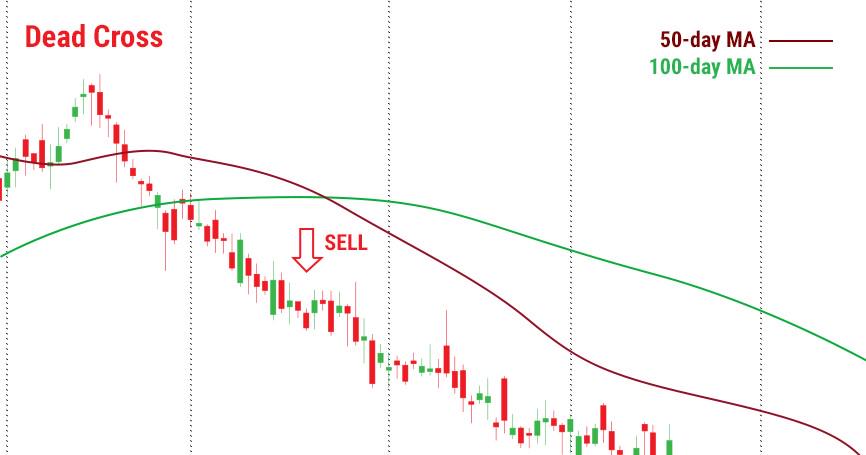
Dead cross
When an MA with a smaller period crosses an MA with a bigger period upside down, it’s a signal to sell.
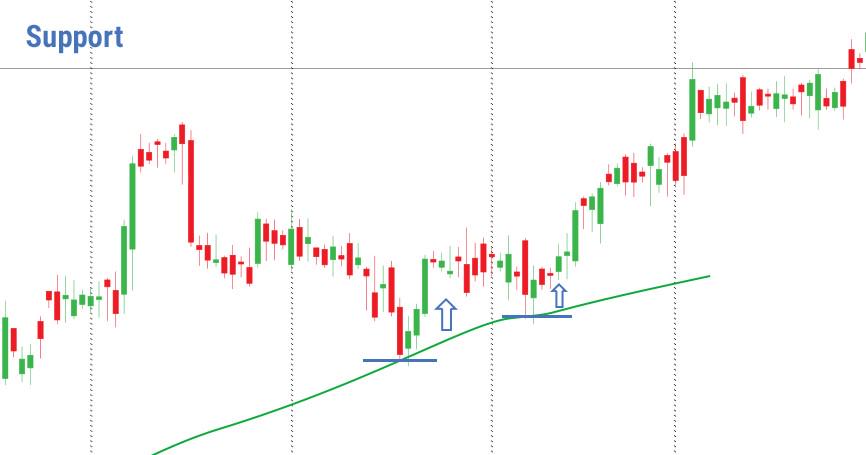
Using MAs as support and resistance levels, we get a chance to determine levels to open a position.
When the price breaks above the MA, it may be a signal to buy. Vice versa, a breakthrough below the MA will give a sign to sell.
Tip: if the price hits the MA several times, it means that a reversal is close.
A great advantage of MAs is that they are not the only indicator; they are a part of other technical indicators. The most famous indicator based on MAs is MACD. You can also find MAs in such trading tools as Alligator, Bollinger Bands, Ichimoku Kinko Hyo.
We always remind traders that there is no perfect indicator that’s why it’s important to combine them to get stronger signals.
It’s always a good idea to use candlesticks. They give strong signals of a reversal and a continuation of the trend. Other indicators that can be used are oscillators.
Remember that you need at least 2 matched signals, to start trading
In brief: let’s generalize what you read above. Moving Average is the trend technical indicator that reflects price moves. It gives delayed signals, however, still is very useful as signals are strong. Buy when the price is above the MA and when you see a golden cross. Sell when the price is below the MA and you come across a dead cross.

