Trading Accounts
Trading Conditions
Financials
CFD Trading instruments

Don’t waste your time – keep track of how NFP affects the US dollar!
The ASIC policy prohibits us from providing services to clients in your region. Are you already registered with FBS and want to continue working in your Personal area?
Personal areaAlthough the market is flat 70% of the time, most of the trading strategies are for trend trading. Thus, most traders use only 30% of the trading potential! If you want to be more productive, pay attention to this strategy.
Prices can move in trends (up/down) or move sideways without any clear direction. This strategy applies to the second option – when the market is flat. Most of the success depends on how good a trader finds the entry and exit points. Sometimes, it’s really hard to define, that’s why traders use technical indicators and price patterns.
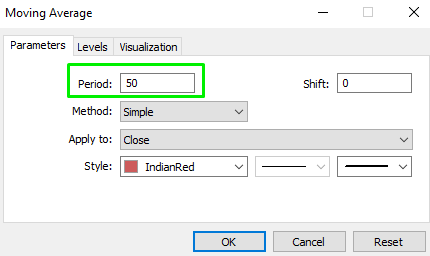
You will need the following indicators for this strategy:
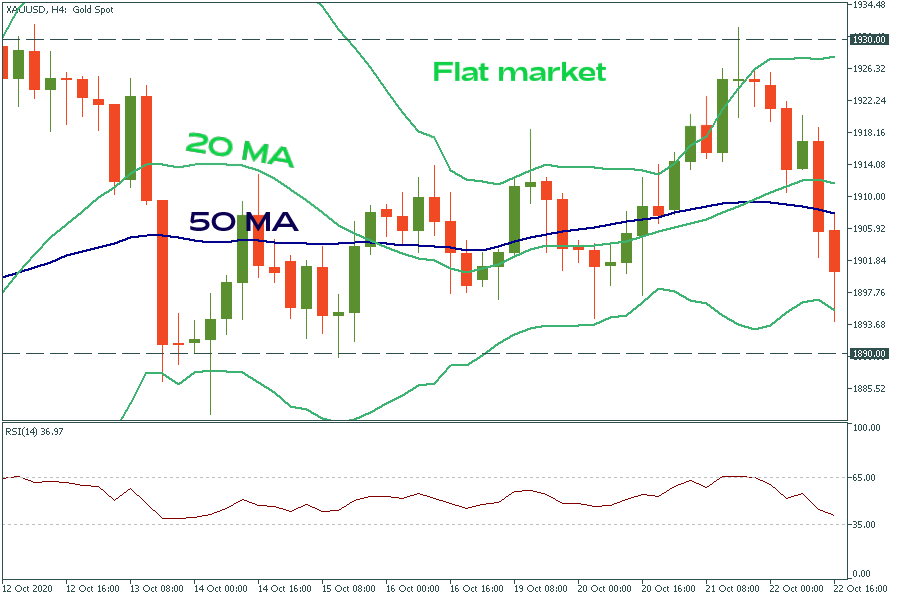
There are two ways of doing that. It’s better to use a 4-hour timeframe (H4).
For beginners
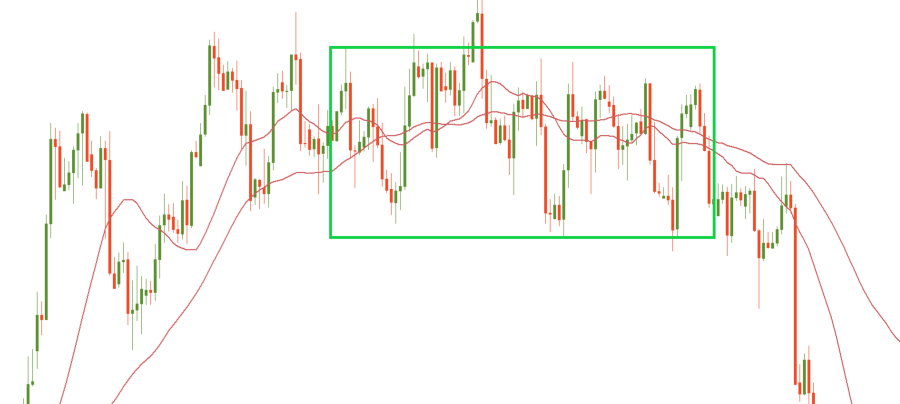
Follow the signals of moving averages. If two moving averages are intersected or move in parallel, it’s a signal that the market is flat. It’s recommended to use 20- and 50-period moving averages for this purpose.
For intermediate traders
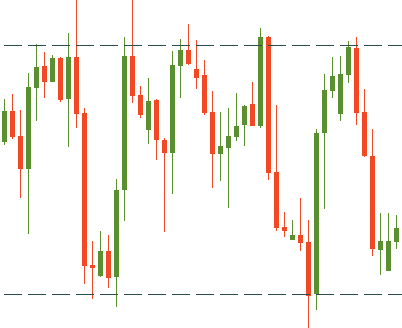
Define at least two price maximums on the same level and draw a horizontal line. Do the same with minimums. After that, you will get a horizontal corridor.
*Tip! Use both approaches and the signal will be stronger.
*Tip! Save the charts with the set indicators as a template. Further on you shouldn’t set these indicators and their settings again. To do that, click on any place of the chart with the right mouse button, then click ‘Templates’, then ‘Save Template’. Done!
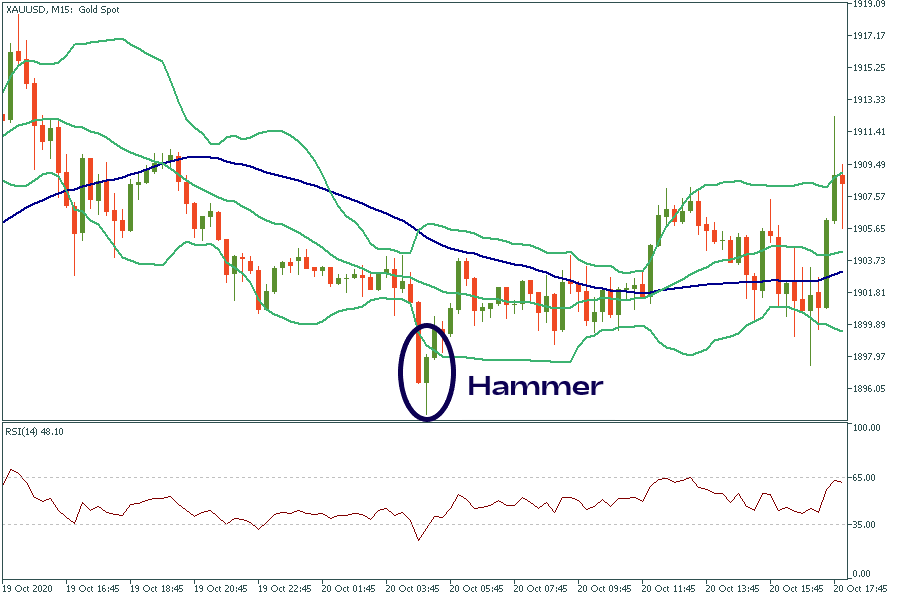
To open a BUY order, all the conditions below should be met.
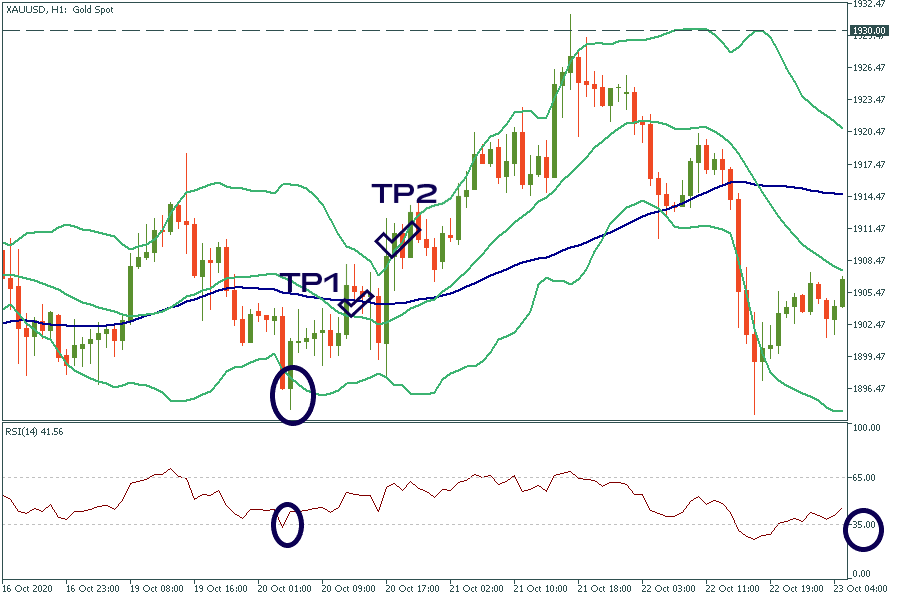
To open a SELL order, all the conditions below should be met.
This strategy suits both beginners and more advanced traders as on the one hand, it is based on simple indicators and on the other hand, requires several levels of filtration and confirmation of trade signals.