
Trading Accounts
Trading Conditions
Financials
CFD Trading instruments

Don’t waste your time – keep track of how NFP affects the US dollar!
The ASIC policy prohibits us from providing services to clients in your region. Are you already registered with FBS and want to continue working in your Personal area?
Personal areaInformation is not investment advice
Fibonacci fan is a tool that will help you analyse trends.
Fibonacci fans are sets of trendlines drawn from a high or a low of the price chart through a set of points dictated by Fibonacci retracements. Just like with Fibonacci retracement, you need to choose the tool and connect a swing high and a swing low with a base line.
Then an ‘invisible’ vertical line, equal to the vertical distance between the high and the low, is drawn from the second extreme point to the level of the first extreme point. Three trend lines are then drawn from the first extreme point, so they pass through the invisible vertical line at the Fibonacci levels of 38.2%, 50.0%, and 61.8%.
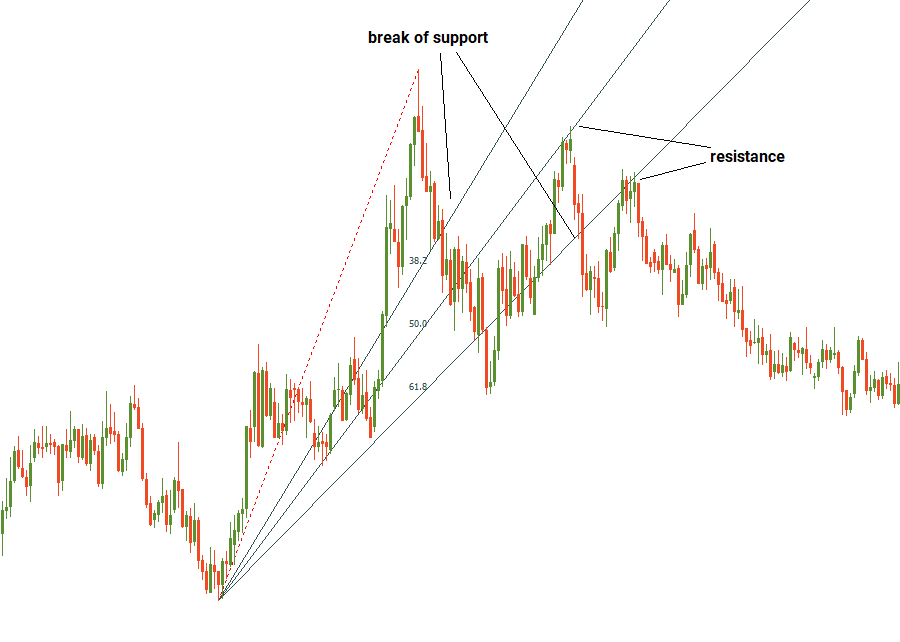
Fibonacci fan lines can act as support or resistance, pinpointing areas at which the price may reverse. As soon as a correction starts, the Fibonacci fan will allow you to see the areas you should pay special attention to.
Notice that because of the fan’s properties, the further out the lines extend (in time), the more sensitive they are to the exact placement of the two marker points. This means a small change in the placement of either of the marker points can result in large movements further out in the extension lines. The fan usually becomes less accurate the further out it extends. When the price is no longer responding to the support or resistance areas of the fan, it is disregarded (this can happen when it extends outside of the active chart area).
Sometimes technical analysts plot several Fibonacci fans, using different waves of the prices. This allows one to place potential reversal areas of the price with greater precision.

