Trading Accounts
Trading Conditions
Financials
CFD Trading instruments

Don’t waste your time – keep track of how NFP affects the US dollar!
The ASIC policy prohibits us from providing services to clients in your region. Are you already registered with FBS and want to continue working in your Personal area?
Personal areaInformation is not investment advice
Have you ever heard about one of the most mysterious and successful traders of all times – William Gann? He is well-known for using geometry, astrology and ancient mathematic to predict the movement of quotes in the financial markets. He was brought up in an impoverished extended family.
To earn crust he had to work on the farm, to sell cigars and newspapers in the trains. From travelers, he knew about the investment, financial markets and great possibilities they can offer. Gann started wondering if it were possible to predict the future. Later on, he moved to New York and started working at a major Wall Street Brokerage house and attending business school at night. A compulsive idea of predicting the future had always been on his brain. So, he began studying the basic principles of price patterns and philosophy on how to accumulate the wealth, then, he proceeded with studying ancient geometry, astrology, mathematic. As a result, he managed to achieve his goal – he became a very successful trader, a real guru who managed to accumulate over 50 mln dollars and open his own brokerage firm. Trying to reveal the secret of his success, traders looked through his numerous writings and found some very effective tools and trading techniques. In this article, we will tell you about so-called Gann indicators (line, angle, fan) that you can find on your trading platform.
Why are the Gann indicators valuable?
With their help, a trader can forecast support and resistance lines.
The primary Gann angles are the 1x2, the 1x1, and the 2x1. The 1x2 combination means that the angle is moving one unit of price for every 2 units of time. The same logic applies to other angles: the first number account for the one price interval, the subsequent one – for the unit of time.
Trading on 1x1, a so-tooth Gann line (refers to the 45-degree angle) means that the market is balanced (the Gann line represents a long-term trend). If price crosses this balance line it means that the dominant trend is about to reverse.
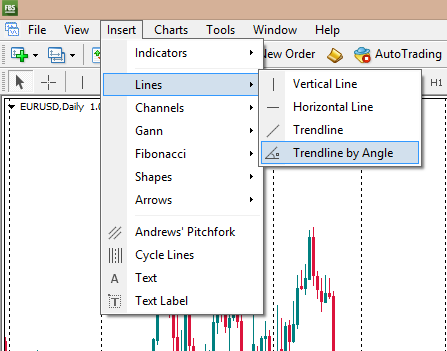
Choose “Insert-Lines-Trendline by angle” in the toolbar of your trading platform and plot the line for the 45-degree angle from the top or bottom.
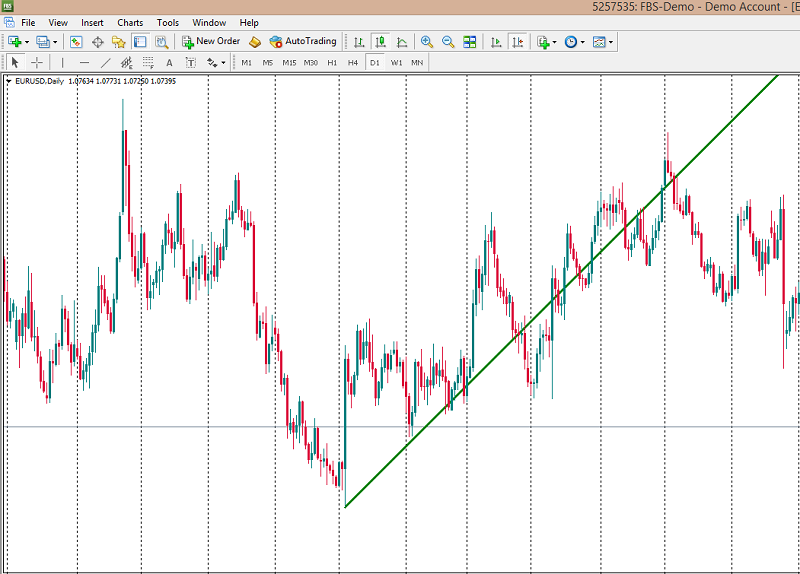
For the bullish trend, it looks as follows, your balance 45-degree line serves as support (hint: after you plotted the line you should rotate it until you reach the degree you need – in your case it is 45°.
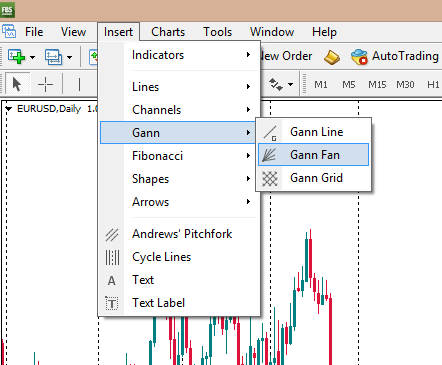
Once you’ve got you’ve built your balanced “one-to-one” line you can lay up the Gann fan.
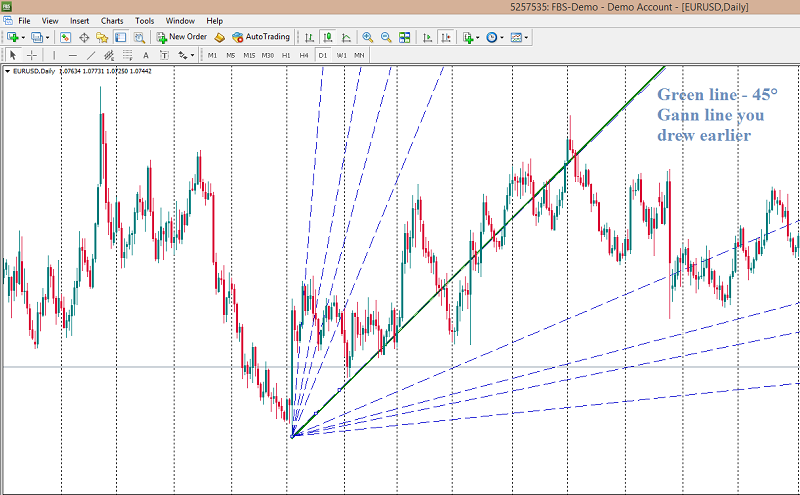
Choose “Insert – Gann – Gann fan” and plot the fan in accordance with the Gann line you drew earlier. The middle line of the fan should correspond to the 45° Gann line.
For bullish trend, it looks as follows, the rays of the Gann fan determine your support levels.