
Trading Accounts
Trading Conditions
Financials
CFD Trading instruments

Don’t waste your time – keep track of how NFP affects the US dollar!
The ASIC policy prohibits us from providing services to clients in your region. Are you already registered with FBS and want to continue working in your Personal area?
Personal areaInformation is not investment advice
A fractal is a pattern in which the same configuration occurs throughout the structure, on a variety of different scales. In other words, it’s a pattern that can be subdivided into similar patterns similar to each other and to the parent pattern.
Just like it’s possible to find Fibonacci ratios in nature, fractals also occur quite often – in plants, crystals, snowflakes, etc.
The idea of fractals was applied to financial markets by Bill Williams. According to him, complex moves of the market are made of self-similar recurring patterns. As a result, although the dynamics of the price may seem random, it’s actually not and has a specific structure.
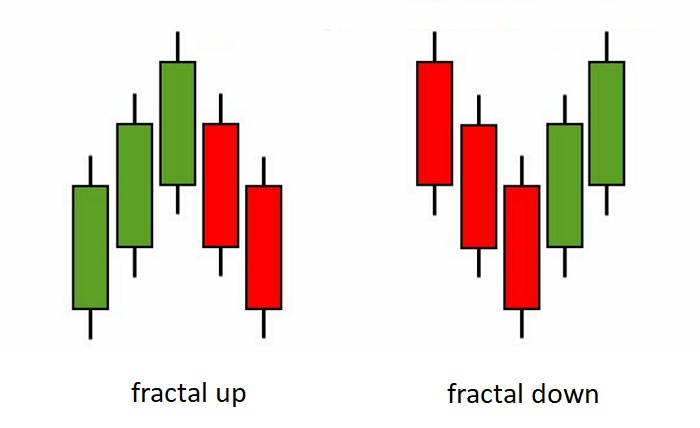
So if we get to the charts, a fractal is considered to be a pattern formed by at least 5 candlesticks in a way that the high/low of the central candlestick exceeds the extremes of the neighboring candles.
A fractal up is a series of five consecutive candlesticks (bars) where the highest high is preceded by two lower highs and is followed by two lower highs. The opposite configuration would be a fractal down. Both structures look like small reversals of the price. Both fractals (buy and sell) may share candlesticks.
It is not an easy task to constantly track fractals visually. You can have fractals marked on your Metatrader chart by clicking “Insert”, choosing “Indicators”, "Bill Williams" and then “Fractals”. The indicator will add a sign at the middle bar of every fractal it recognizes.
After you added the Fractals indicator to a chart, you can hunt for trade signals. Here’s the method proposed by Bill Williams:
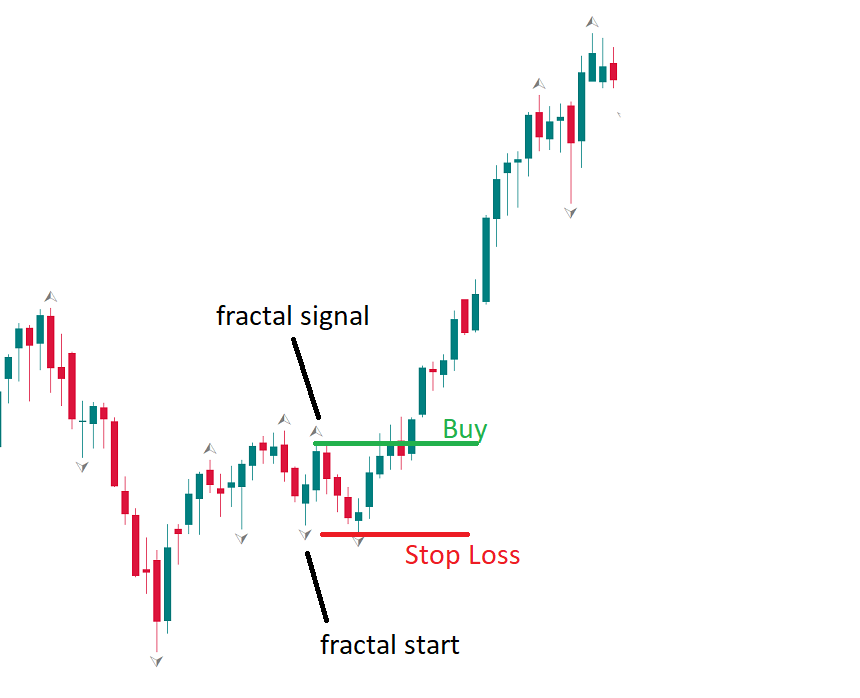
The Fractals indicator can produce a lot of signals. It’s wise to use it together with other technical indicators developed by Williams in order to filter the good signals from the bad ones.

