
Trading Accounts
Trading Conditions
Financials
CFD Trading instruments

Don’t waste your time – keep track of how NFP affects the US dollar!
The ASIC policy prohibits us from providing services to clients in your region. Are you already registered with FBS and want to continue working in your Personal area?
Personal areaInformation is not investment advice
An indicator that is called “Awesome Oscillator” can’t disappoint traders. Learn how to use this tool correctly!
Awesome Oscillator (AO) is another indicator developed by Bill Williams. To add it to your chart in Metatrader, click “Insert”, choose “Indicators”, "Bill Williams" and then “Awesome Oscillator”.
The main task of the Awesome Oscillator is to measure the dynamics of momentum. To be precise, it compares momentum for the last 5 candlesticks with the momentum of the last 34 candlesticks at a bigger timeframe. The value of the Awesome Oscillator indicator is calculated as the difference between moving averages over these timeframes. The Simple Moving Averages that are used are not calculated using closing price but using midpoints of each candlestick.
As the parameters of the indicator are specific, you don’t need to fill in any settings, you can only adjust its color scheme.
The Awesome Oscillator provides several types of signals by helping to predict reversals and corrections of the price.
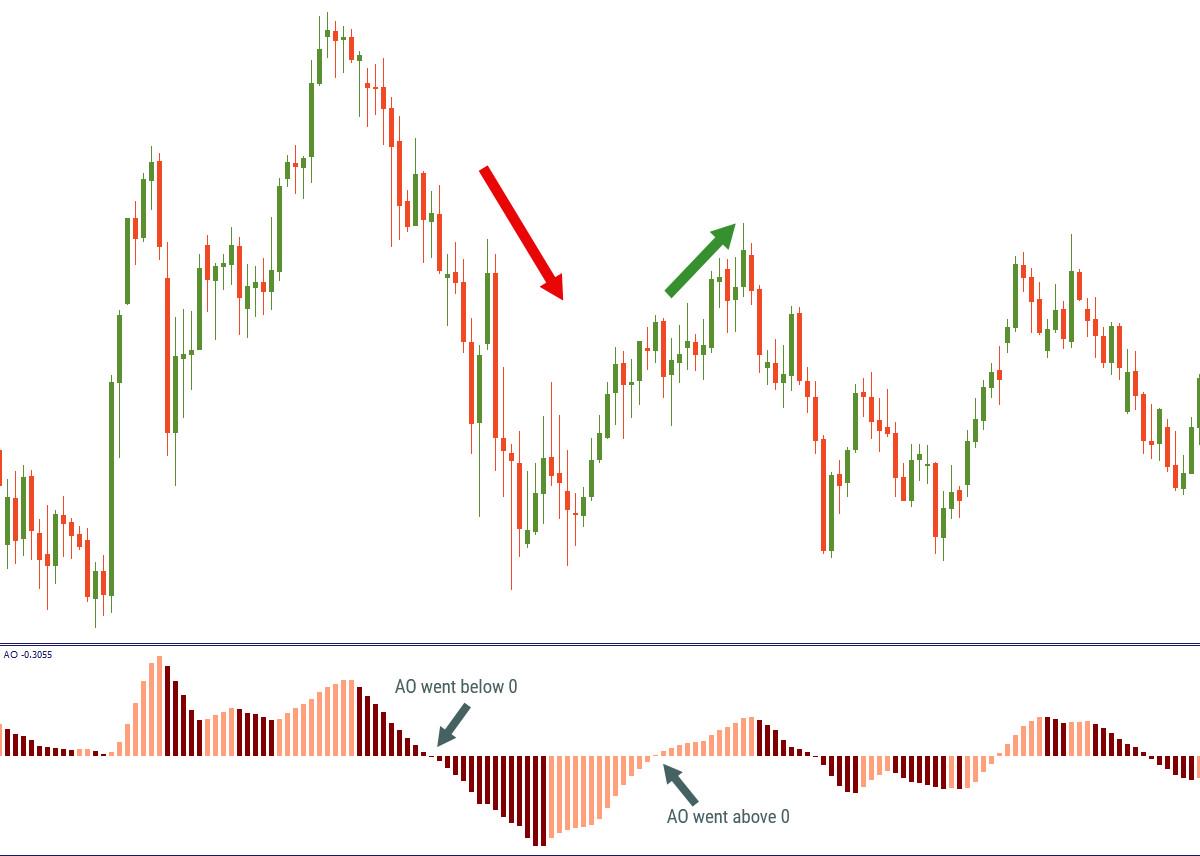
First of all, the indicator fluctuates around the zero line. If it rises above 0, the signal is bullish. If AO drops below 0, the signal is bearish.
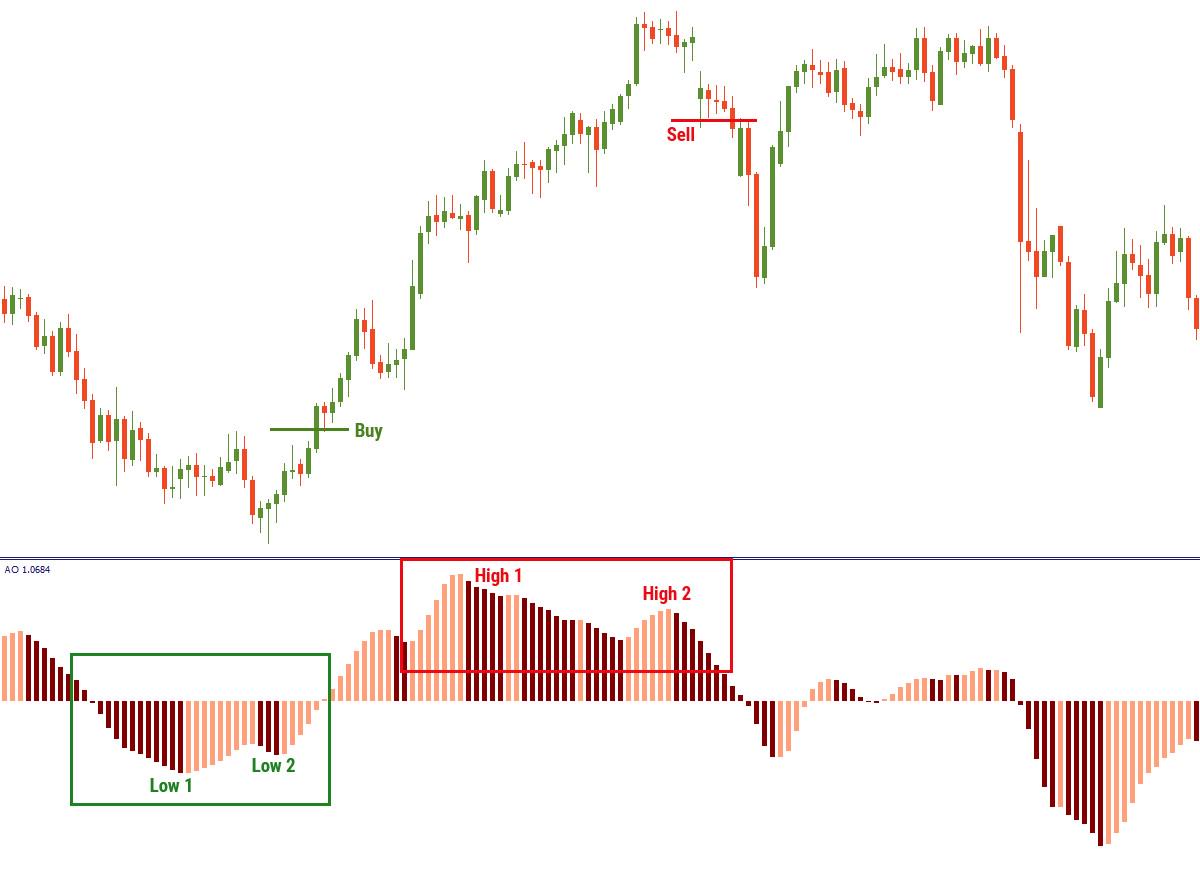
Secondly, if Awesome Oscillator has formed two highs above 0 and the trough between them is also above 0, it’s a bearish signal. The second peak must be lower (closer to 0) than the first one and should be followed by a red bearish bar. Same way, if Awesome Oscillator has formed two lows below 0 and the trough between them is also below 0, it’s a bullish signal. The second peak must be higher (closer to 0) than the first one and should be followed by a green bullish bar.
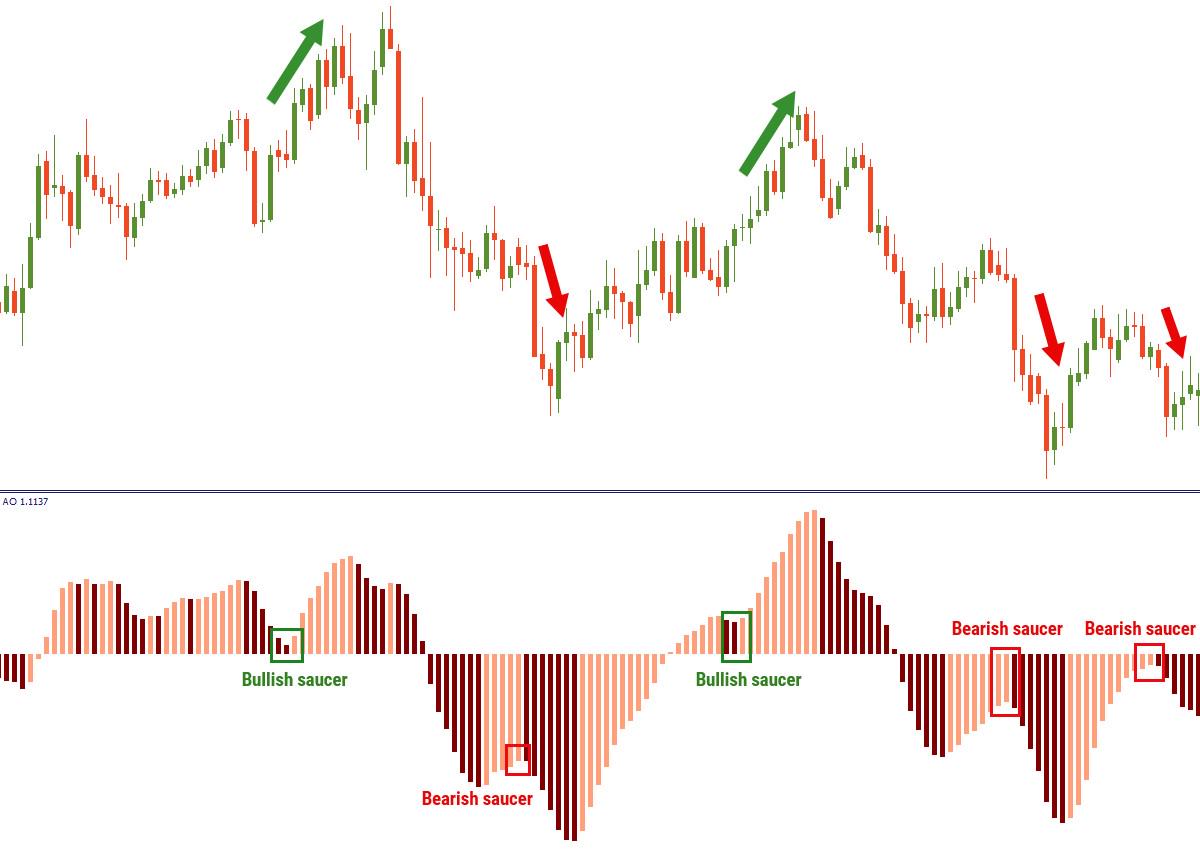
The third signal is called a “saucer”. It’s a pattern made of the indicator’s 3 bars. A bullish saucer consists of a red bar, followed by a smaller red bar, followed by a green bar. All the bars should be above 0. A bearish saucer consists of a green bar, followed by a smaller green bar, followed by a red bar — all of them should be below 0.
The Awesome Oscillator produces a lot of signals. It’s natural that not all of them work. A bullish signal of the indicator means that the price is likely to go up but the probability of that is not 100%. That’s why we recommend using other tools of technical analysis to combine with the Awesome Oscillator and design a good trading system.

