
Trading Accounts
Trading Conditions
Financials
CFD Trading instruments

Don’t waste your time – keep track of how NFP affects the US dollar!
The ASIC policy prohibits us from providing services to clients in your region. Are you already registered with FBS and want to continue working in your Personal area?
Personal areaInformation is not investment advice
There are a lot of different candlestick patterns. When traders recognize these patterns on the chart, they act accordingly. As a result, the probability that a certain price action will follow a specific pattern is high.
Traders examine candlestick patterns through the visual analysis of the charts. There are also different pattern recognition indicators for MetaTrader. You can install them in your trading software. Still, even if an indicator or an expert advisor highlights the patterns on the charts for you, you will need to know what each pattern means.
There are two main types of candlestick patterns: reversal patterns and continuation patterns. As it’s evident from these names, they show the likely further direction of the market relative to the previous price action.
Reversal patterns indicate the high odds that a trend will change direction or make a deep correction. These patterns help to identify possible entry points at the beginning of the new trend or a big counter-trend move.
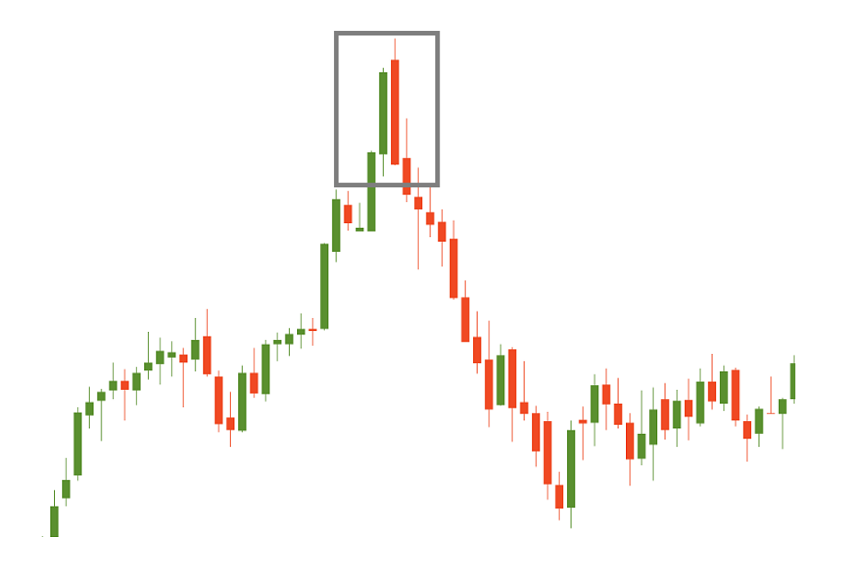
Not every reversal pattern has a similar weight. It’s very important where such a pattern took place and what happened before it. The reversal signal is strong in 2 cases:
In the picture below you can see an example of a strong reversal signal: the reversal candlestick pattern formed after a strong uptrend.
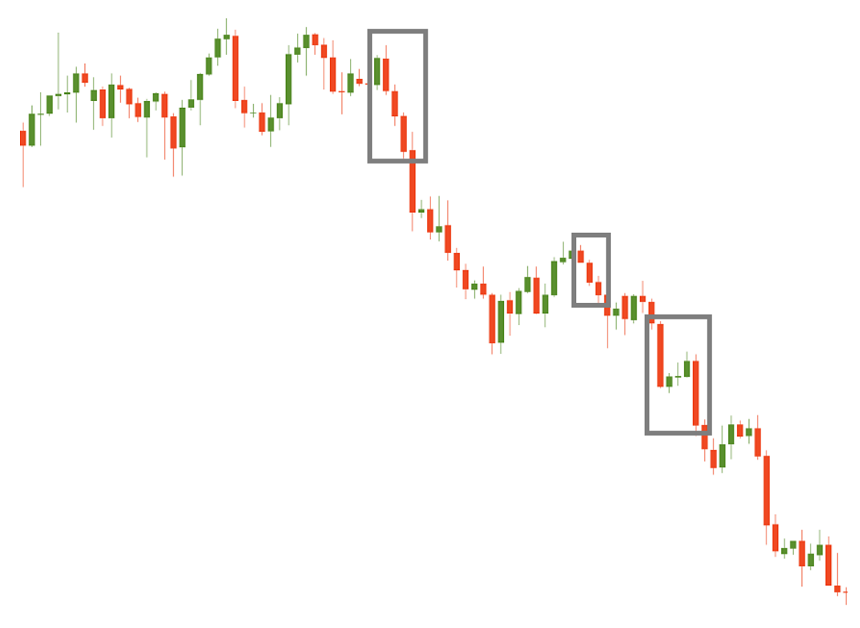
Continuation patterns suggest that the market will maintain an existing trend after a pause. These patterns help to find a new entry point in line with a trend, as well as provide evidence for holding the already open positions or adding to them.
Notice that reversal patterns are easier to recognize than the continuation ones. As a result, for beginner traders, we recommend starting learning the patterns from the reversal ones.
It’s also possible to break the candlestick patterns into bullish and bearish ones. In most cases, they represent the mirror images of each other.
In the following tutorials, we explain the most popular reversal and continuation candlestick patterns.

