
Trading Accounts
Trading Conditions
Financials
CFD Trading instruments

Don’t waste your time – keep track of how NFP affects the US dollar!
The ASIC policy prohibits us from providing services to clients in your region. Are you already registered with FBS and want to continue working in your Personal area?
Personal areaInformation is not investment advice
Let’s continue our study of technical indicators developed by Bill Williams. Market facilitation index (MFI) measures the strength or weakness behind movements of the price. As you can see from its name, the idea of the indicator is to make trading easier for you. Using MFI you will be able to say 3 important things:
To add it to your chart in Metatrader, click “Insert”, choose “Indicators”, "Bill Williams" and then “Market Facilitation Index”.
MFI combines changes in price (range) and volume. Here’s its formula:
MFI = (High – Low) * Volume
The indicator has bars of 4 colors. Each color has a specific meaning and shows how the market responds to a change in volume.
Green. A green bar forms in the situation that both MFI and the volume are up. It means that more and more traders join the market in the current direction. In other words, it points to a strong trend, so you can open trades in line with this trend.
Brown. A brown bar appears when both MFI and the volume decline. It is also called “fade”. It signals that traders are hesitating and don’t want to continue the trend anymore. As a result, it’s not recommended to join the trend. Several brown bars are a sign of the potential reversal of the trend.
Blue. A blue bar forms when MFI increases, but the volume declines. A spike in price may be short-lived a precede a change in the trend. Blue bars appear at the times when newbies enter the trend, but professional traders know that it’s already too dangerous.
Pink. A pink bar, also known as squat, appears when MFI is diminishing, but the volume is growing. It reflects an increase of trading interest and an active fight between buyers and sellers. After one of the sides wins, the price will likely make a big move breaking support or resistance levels. The MFI, however, can’t be used to determine the direction of the breakout.
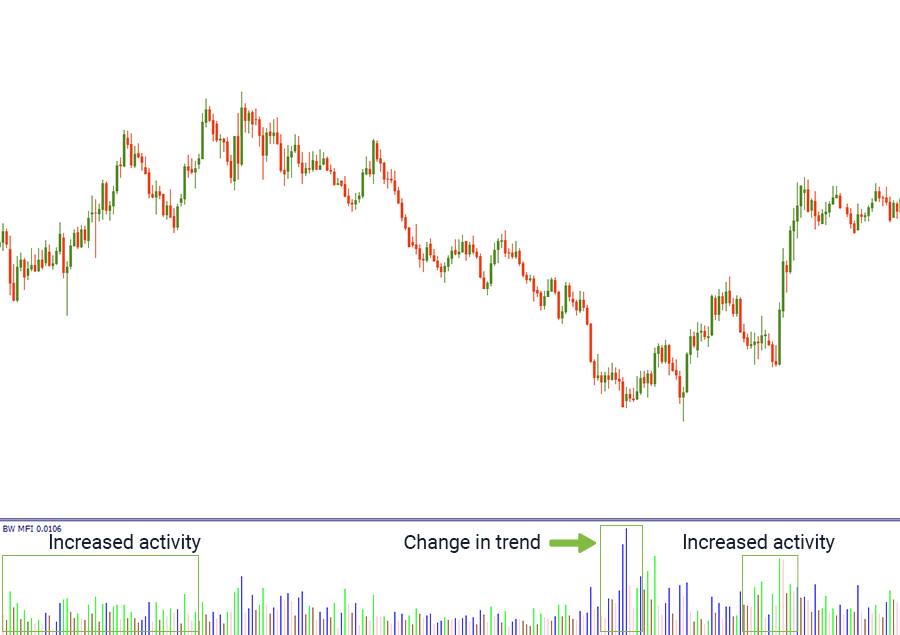
The colors of MFI bars provide traders with important information about the market. Green or pink bars which correspond to increasing volume usually mean that there’s a trading opportunity. You can also compare the indicator’s bar with the preceding one to see whether conditions for trading become better or worse.
Like many other technical indicators, it’s not the best option to make trades on the basis of MFI alone. Bill Williams advised combining MFI with Fractals and other indicators, for example, Alligator or Moving Average.

