
Trading Accounts
Trading Conditions
Financials
CFD Trading instruments

Don’t waste your time – keep track of how NFP affects the US dollar!
The ASIC policy prohibits us from providing services to clients in your region. Are you already registered with FBS and want to continue working in your Personal area?
Personal areaInformation is not investment advice
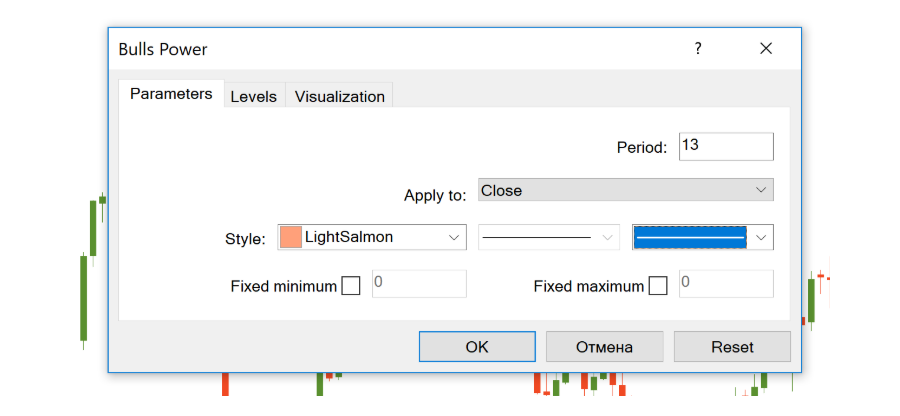
The Bull Power and Bear Power are the oscillators developed by Dr Alexander Elder. They measure the power of buyers (bulls) and sellers (bears) to push the price in their favour, i.e. above or below a baseline. The two indicators combined are known as Elder-Ray Index. The function of a baseline is often performed by a 13-period Exponential Moving Average (EMA) of closing prices.
The logic is simple: the market situation is constantly changing as bears turn into bulls and vice versa. The indicators help to track this conversion and trade on it.
The Bull Power and the Bear Power are installed by default in MetaTrader. You can add them to the chart by clicking ‘Insert’ – ‘Indicators’ – ‘Oscillators’ and then choosing ‘Bull Power’/’Bear Power’.
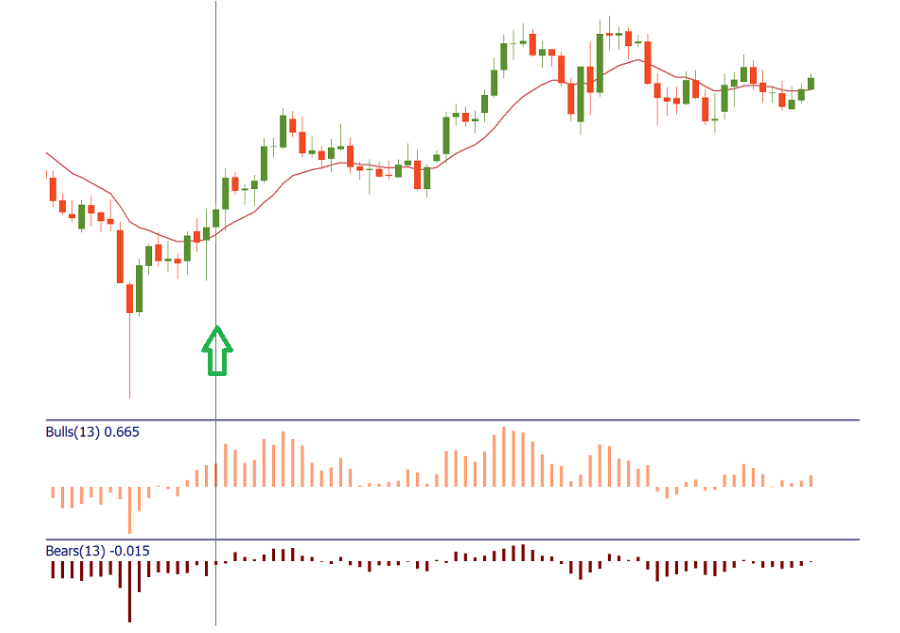
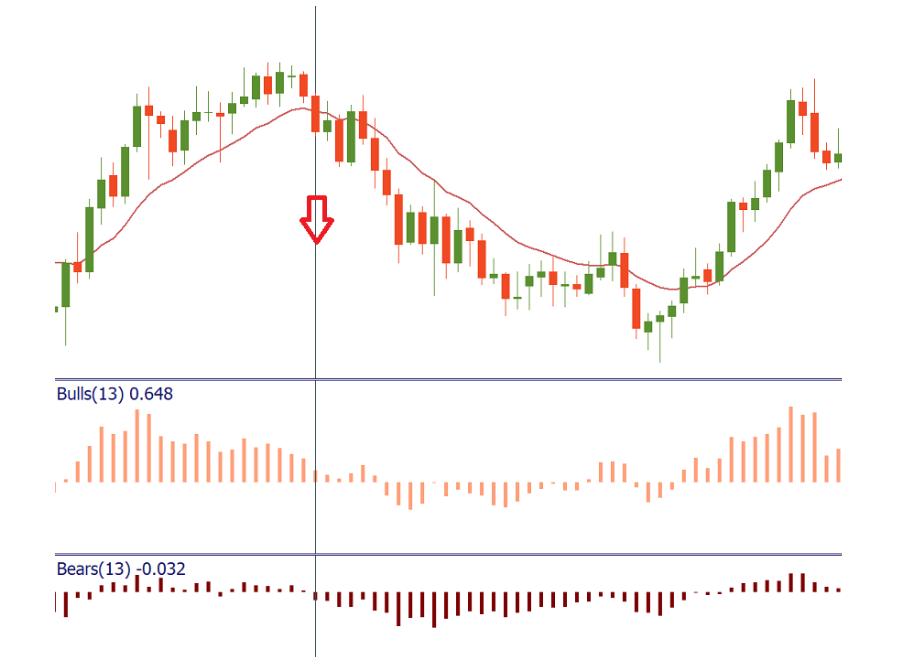
You can use the indicators individually, but there’s much more sense to use them together as was planned by Elder. In addition to both indicators, plot the 13 EMA itself on the chart as well. This way, you will combine the oscillators with a trend-following tool and increase the quality of the entry signals. The exponential moving average acts as a filter: it shows a trend so that a trader could pick only those signals which go in the direction of this trend.
All three indicators form a kind of basis for a trading strategy.
A setup for a buy trade occurs when the following conditions are met:
There are also other optional cut desirable conditions:
It is better not to go long if the Bears Power is positive.
A setup for a sell occurs when the following conditions are met:
There are also other optional cut desirable conditions:
It is better not to go short if the Bulls Power is negative.
All in all, the Bulls/Bears Power indicator allows seeing the forces that are driving the market and suggests a simple but efficient basis for a trading strategy.

