
Trading Accounts
Trading Conditions
Financials
CFD Trading instruments

Don’t waste your time – keep track of how NFP affects the US dollar!
The ASIC policy prohibits us from providing services to clients in your region. Are you already registered with FBS and want to continue working in your Personal area?
Personal areaInformation is not investment advice
The Relative Vigor Index (RVI) measures the trend strength by comparing an asset’s closing price to its trading range and smoothing the results.
The indicator is based on the idea that in a bull market, the closing price is, in general, higher than the opening price. In this, the RVI resembles the Stochastic Oscillator. The difference between the two is that the RVI compares the close relative to the open rather than the close relative to the low.
The RVI is already installed in the MetaTrader default indicator kit, so you don’t need to download it. Go to ‘Insert’, find ‘Indicators’ and then ‘Oscillators’ – and you will see the RVI. The indicator will appear in a separate window below the price chart.
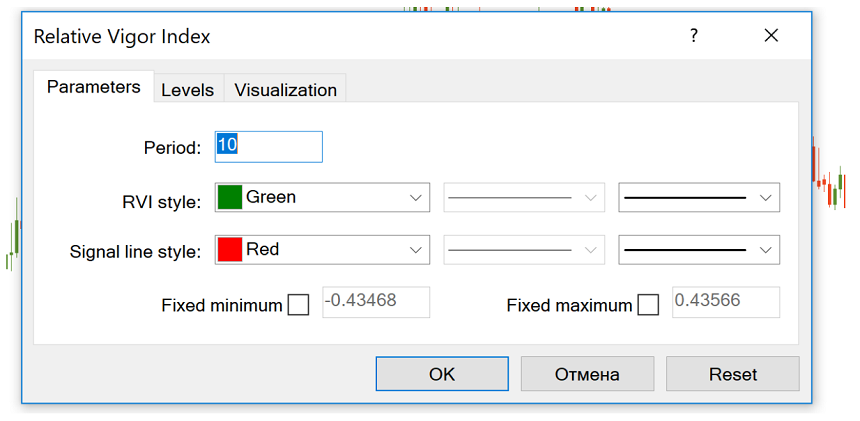
The reading of 10 is considered the most suitable period. The indicator has two lines. One is the RVI line itself; the other is a signal line, which is a moving average of the indicator with a period of 4.
The RVI oscillates across a centerline. It is interpreted in the same way as many other oscillators, for example, MACD and RSI. In particular, the RVI shows when the market is overbought or oversold and sends signals when it diverges from the price chart.
Overbought/oversold conditions. If the market is flat, look for the RVI to exit the overbought (high) or oversold (low) areas for a signal to sell/buy. Note that the indicator doesn’t offer exact levels for overbought and oversold areas, so traders need to figure this out themselves. In addition, it’s necessary to remember that oscillators can remain at extreme levels over a prolonged period of time.
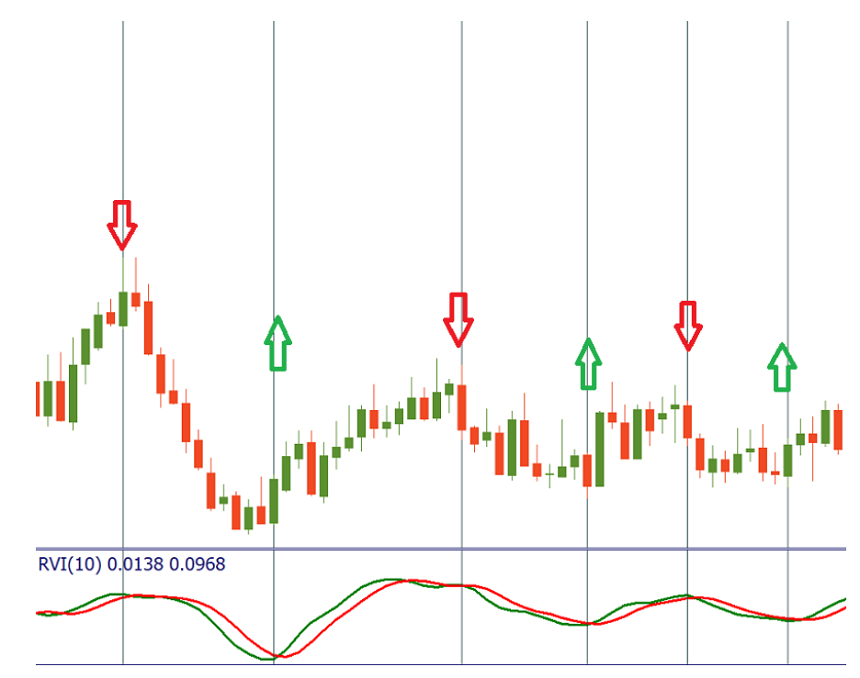
Signal line crossovers. Watch for crossovers between the RVI and the signal line. When the indicator rises above the signal line, it’s a bullish sign. When the indicator goes below the signal line, it’s a bearish sign.
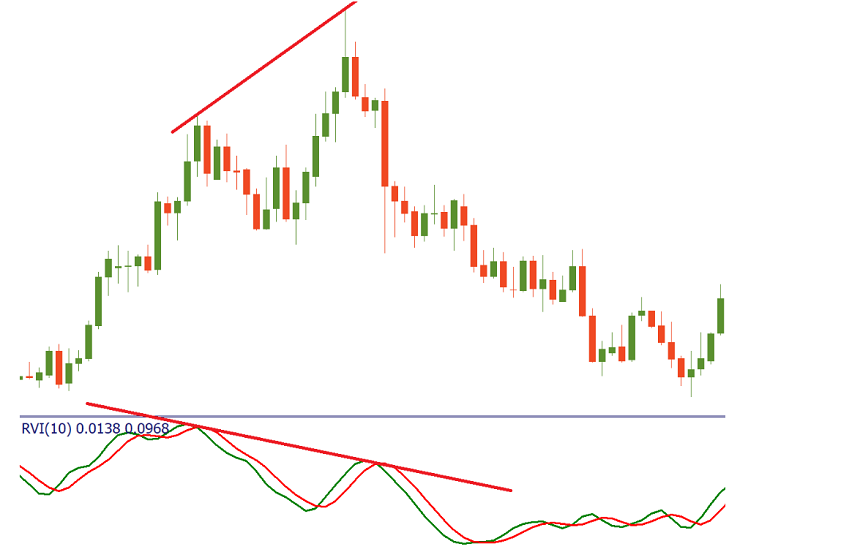
Convergence/divergence. If a new price high is higher than the previous one, while the new RVI high is lower than the previous one (bearish divergence), look for the RVI to cross the signal line to the downside and then sell. If a new price low is below the previous one, while the new RVI low is higher than the previous one (bullish divergence), look for the RVI to cross the signal line bottom-up and then buy.
Relative Vigor Index is useful for trading but may give false signals, so it has to be used in combination with other indicators and trading tools.

