
Trading Accounts
Trading Conditions
Financials
CFD Trading instruments

Don’t waste your time – keep track of how NFP affects the US dollar!
The ASIC policy prohibits us from providing services to clients in your region. Are you already registered with FBS and want to continue working in your Personal area?
Personal areaInformation is not investment advice
Commodity Channel Index (CCI) is a technical indicator developed by Donald Lambert in 1980. It shows when the market is overbought/oversold and helps to assess the direction and the strength of a trend, as well as spot new trends.
The CCI is preinstalled in the MetaTrader default indicator kit, so you don’t need to download it. Go to ‘Insert’, find ‘Indicators’ and then ‘Oscillators’ – and you will see the Commodity Channel Index. The indicator will appear in a separate window below the price chart.
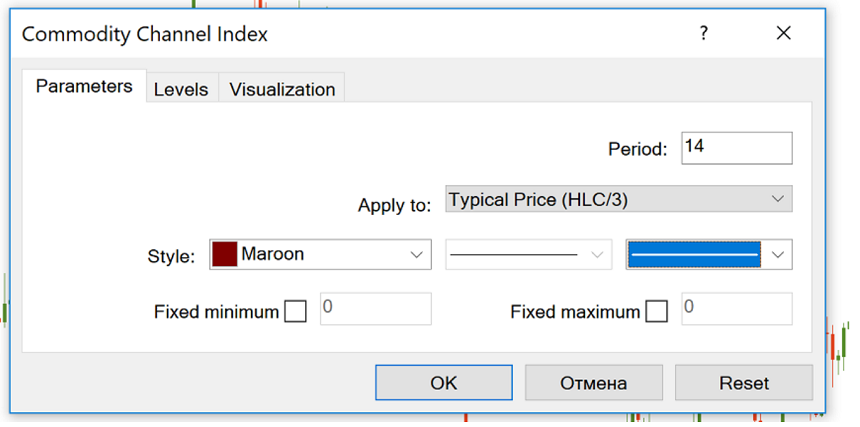
The indicator’s dynamics depends on the number of periods that were used to form it. The smaller the period, the more volatile the indicator will be and the more time it will spend outside of the ±100 range. By default, MetaTrader proposes ‘14’ as the CCI period. Another popular setting is 20 periods.
CCI measures the difference between the current price and the historical average price. The indicator oscillates across the centerline. When it is above zero, it means that the price is above the historical average. Consequently, when it is below zero, the price is below the historical average.
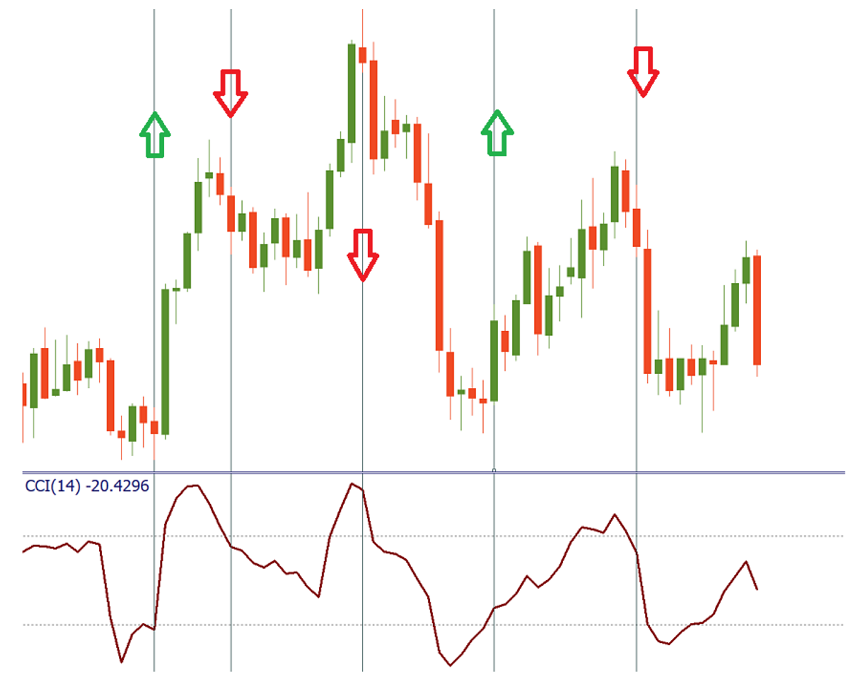
Overbought/oversold conditions. As you can see, the levels of +100 and -100 are marked in the CCI chart. If the indicator rises above +100, it means the pair is overbought and the possibility of a downward correction has increased. When CCI reverses down from positive or near-zero readings and makes its way to -100, it points to an emerging downtrend.
A decline below -100 means the downtrend had been strong and the market became oversold. When CCI turns up from negative near-zero readings and starts moving toward +100, it’s a sign of an emerging uptrend.
Notice that the indicator doesn’t have an upside or a downside limit per se, although it will always tend to return to the median 0 level. As a result, it’s necessary to look to past indicator readings to get a sense of where the price had reversed. This necessity to interpret things makes the indicator somewhat subjective.
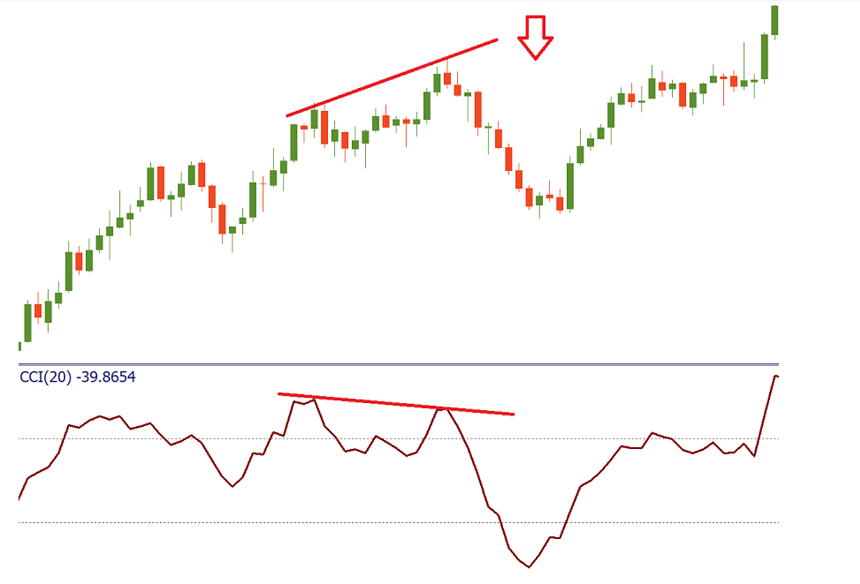
Divergence/Convergence. Divergence occurs when price forms a higher maximum, but CCI forms a lower one. It can be confirmed by a break of CCI below zero or a break of support on the price chart. Conversely, convergence occurs when the price forms a lower low, but CCI forms a higher low. It can be confirmed by a CCI break above zero or a break of resistance on the price chart.
Like any other technical indicator, CCI has its drawbacks. Apart from the subjectivity we mentioned earlier, it’s necessary to point out that the indicator is lagging behind the price. As a result, the signals may turn up too late and thus be false. To solve this problem, use CCI together with the analysis of price action and other technical indicators that will confirm or reject its signals.

