
Trading Accounts
Trading Conditions
Financials
CFD Trading instruments

Don’t waste your time – keep track of how NFP affects the US dollar!
The ASIC policy prohibits us from providing services to clients in your region. Are you already registered with FBS and want to continue working in your Personal area?
Personal areaInformation is not investment advice
This is one of the harder topics, but if you are persistent enough to learn this type of analysis, the result would pay for the effort. The aim of this method is to recognize specific markets structures called “harmonic patterns” and generate trade ideas with their help.
Harmonic patterns were discovered by H.M. Gartley in 1932. Later the theory was developed by Larry Pesavento, who wrote a book Fibonacci Ratios with Pattern Recognition.
Harmonic patterns are similar to chart patterns like “Head and shoulders” in a sense that they are based on a specific shape of price action. However, harmonic patterns have something special about them: they are based on the use of Fibonacci tools (retracements and expansions). Such a combination allows these patterns to produce accurate and reliable trade signals. The main idea is to identify the levels at which the general trend will resume after a correction as well as this trend’s targets.
There are many different harmonic patterns: ABCD, Butterfly, Gartley, Shark, Crab, Bat, etc. These patterns can be either bullish or bearish. Many patterns may look rather similar to each other but have some distinctions. The art of harmonic trading is the ability to differentiate between these patterns. Technical analysis assumes that history repeats itself. As a result, the idea is that these patterns will occur in the future and will have the same effect as they did in the past.
We will explain how to trade each pattern in the further articles.
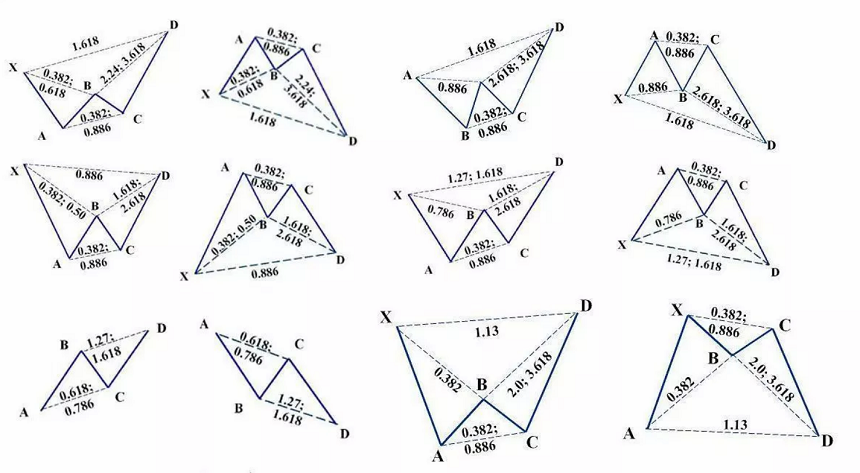
The main advantage of harmonic patterns is that you won’t need to make guesses because you can rely on specific Fibonacci numbers.
The numbers used in harmonic patterns are either directly or indirectly derived from the 0.618 and 1.618 ratios of the Fibonacci sequence. These derived numbers include 0.786, 0.886, 1.13, and 1.27. There are also many complimentary numbers: 0.382, 0.50, 0.707, 1.41, 2.0, 2.24, 2.618, 3.14, and 3.618. These numbers validate harmonic patterns and determine areas of potential changes in the price.
To achieve positive results using harmonic patterns, you will need to:
The closer is a harmonic pattern seen on the chart to the proportions described for this pattern in textbooks, the higher the probability that it will produce a good trade signal. Notice that it’s necessary to wait until the pattern is formed before trading on its signal.

