
Trading Accounts
Trading Conditions
Financials
CFD Trading instruments

Don’t waste your time – keep track of how NFP affects the US dollar!
The ASIC policy prohibits us from providing services to clients in your region. Are you already registered with FBS and want to continue working in your Personal area?
Personal areaInformation is not investment advice
Wolfe waves pattern is an advanced chart pattern for experienced traders.
The idea that the market moves in a series of waves was developed by Ralph Nelson Elliott. Bill Wolfe proposed his own view on waves in technical analysis. The price in a Wolfe waves pattern is swinging like a pendulum trying to find equilibrium. Wolfe discovered a reversal pattern, so after trading within a channel during 4 waves, the price makes a breakout (leaves the channel) in the fifth wave.
A Wolfe waves pattern can be found on any timeframe and on the chart of any financial instrument.
There’s a very strict set of rules that define this pattern. Let’s study a bullish Wolfe waves pattern first.
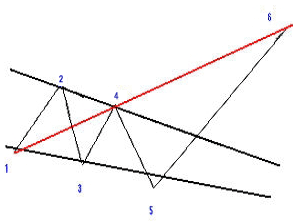
Here are the key parameters of bullish wolfe pattern:
The idea of trading the bullish Wolfe waves pattern is to buy at point 5. Take Profit order should be located at point 6.
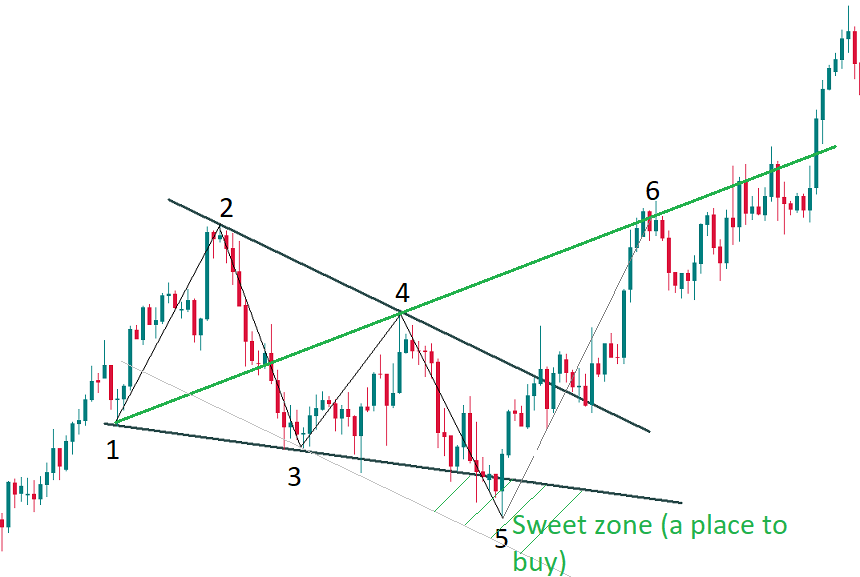
Point 5 can be at or below the 1-3 line. In this case, draw an auxiliary line through points 2 and 4 and move this line in parallel to point 3. The space between the line 1-3 and the projection of the line 2-4 from point 3 is called the ‘sweet zone’. This is where one could look for the opportunity to buy. If the 2-4 line is parallel to the 1-3 line, then there’s no sweet zone. If the angle between the lines 1-3 and the projection of the line 2-4 is too, there’s a mistake and it’s not a Wolfe waves pattern. Check the example of a bullish Wolfe waves pattern in MetaTrader:
Now let’s examine a bearish Wolfe waves pattern.
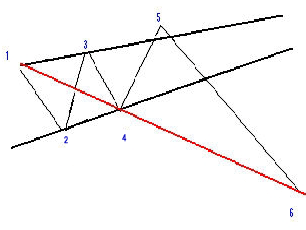
Here are key parameters of the bearish wolf pattern:
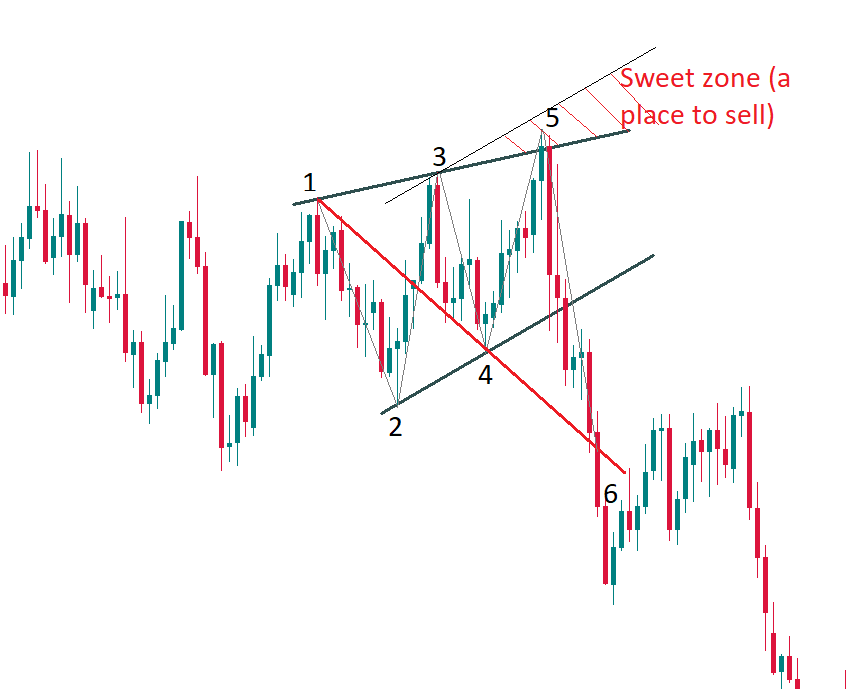
Like the mirror of a bullish Wolfe waves pattern, the idea of trading the bearish Wolfe waves pattern is to sell at point 5 (in the ‘sweet zone’ for selling formed by drawing a line parallel to the line 2-4 from point 3). Take Profit order should be located at point 6. Here’s what such trade looks like on a real chart:
To find a Wolfe waves pattern on the chart, look for 3 points that lie at about one line. Check for points 2 and 4 nearby and see whether it all fits the description of a bullish or bearish pattern.
We recommend trading Wolfe waves patterns for those who already have some Forex trading experience because it’s not easy to recognise these setups on the charts. However, once recognised, the pattern generates a signal that offers a very high probability of a positive trade.

