
Trading Accounts
Trading Conditions
Financials
CFD Trading instruments

Don’t waste your time – keep track of how NFP affects the US dollar!
The ASIC policy prohibits us from providing services to clients in your region. Are you already registered with FBS and want to continue working in your Personal area?
Personal areaInformation is not investment advice
You probably heard something about Elliott waves or even saw wave counts. Nowadays, Elliott wave analysis has become one of the most popular approaches to Forex market forecasting. Why? In our experience, Elliott Wave Principle is the only tool that can sort out the price movement on every timeframe from Monthly or even Yearly chars to just one-minute intraday intervals. For example, you can trade on intraday charts, but at the same time, you can also see the bigger picture. Simply put, Elliott waves are the DNA of the market. In the following articles, we will guide you through the Elliott Wave Principle.
We should thank Ralph Nelson Elliott (1871 - 1948), who was an accountant and economist. In 1938 he published ‘The Wave Principle’; his second book, ‘Nature’s Law - The Secret of the Universe’ was printed in 1946. Elliott described patterns that repeatedly form on the market according to very well-defined rules.
We must also thank Robert R. Prechter Jr. and A.J. Frost for the book ‘Elliott Wave Principle: Key to Market Behavior’, which is the primary source of rules and guidelines today. And furthermore, in 2006 another great book was published – ‘Elliott’s Code’ by D.V. Vozny. Unfortunately for many readers around the world, this book is in Russian.
So, this series of articles is based on the two books. Any rule or guideline in any article fits the rules in these publications. And rest assured, we’re not just retelling the books. Here we will teach you about the Elliott Wave Principle and share real-life experience. Most examples will be from the real market. We’ll also go through some cases that weren’t described in the books, but you can find them on the charts.
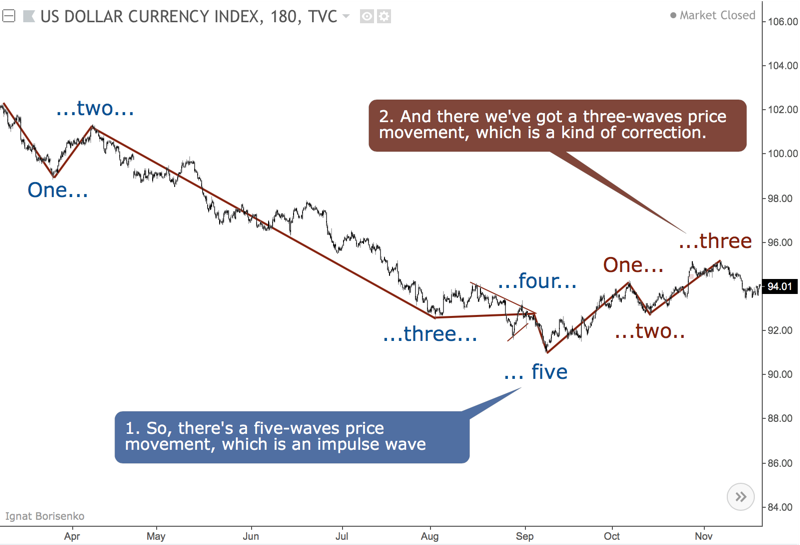
There’re two main things in the Elliott Wave Principle: impulses (five-waves price movements) and corrections (three-wave price movements). We’ll come back to this in the next articles, so you’ll see that there’s just one main LEGO block, which is an impulse. But for now, let’s focus on these two.
Take a look at the chart below. You can see a 5-wave decline – that’s an impulse wave (there’re some cases where we could have a 5-wave correction, but that comes later in the article). Also, there’s a 3-wave advance, which we could consider a correction. Now that we found an impulse and a correction, it’s time to look at the bigger picture.
The next chart is just the real wave count. The decline is likely in the third wave of a bearish impulse, and an upward bounce is in its fourth wave.
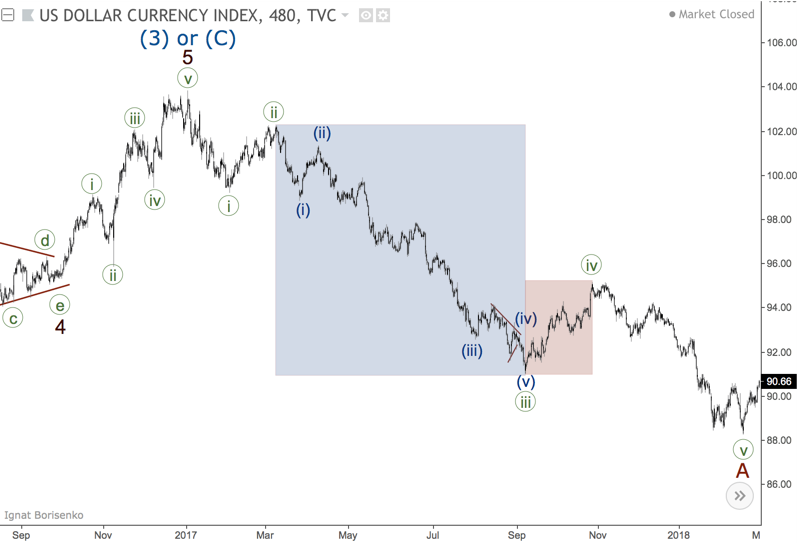
So, we can come to the following conclusion: no wave can stay apart from others. The Elliot Wave Principle is like a Russian nesting doll (Matryoshka). Each wave is a part of another wave, but also each wave consists of smaller waves. This is repeated in longer and shorter timeframes.
And this makes the Elliott Wave Principle different from other market analysis techniques. The majority of the technical analysis approaches focus on patterns and signals that stand aside from each other. The power of EWP is an ability to see the bigger picture, not just an individual setup.
You’ve probably heard that if you use the EWP in trading, you will come across more than one possible wave counts. Usually, you have a few possible scenarios, which sometimes are contradictory. This is the most exciting thing about the EWP because it’s like playing chess.
If some holy-grail indicator tells you to buy or sell, you wouldn’t think what you’re going to do if something goes wrong. With the EWP, you are trying to figure out trading actions depending on which wave count is in place. That’s a core skill of an experienced trader.
Let’s get to some real stories. The first example is the DJI index. In September 2016, the index reached its historical high. We expected the market much higher because the fifth wave was far from over.
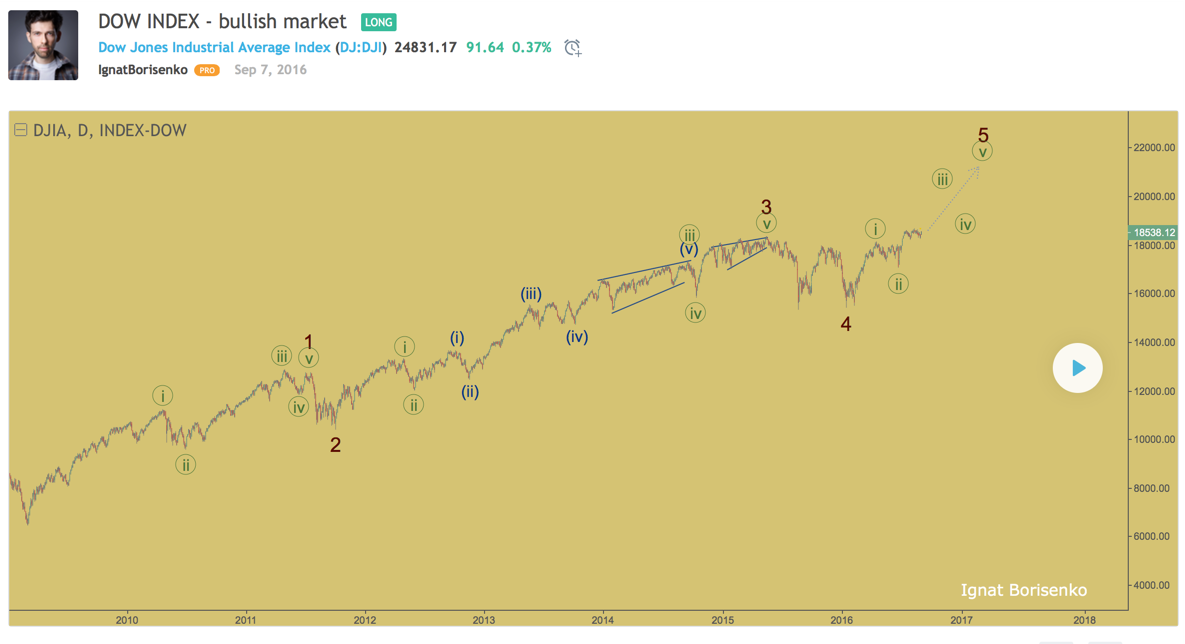
A few months later, the market climbed even higher, but we were still bullish. This expectation was based on some things in the EWP we’re going to learn soon, but for now, you can see how it worked.
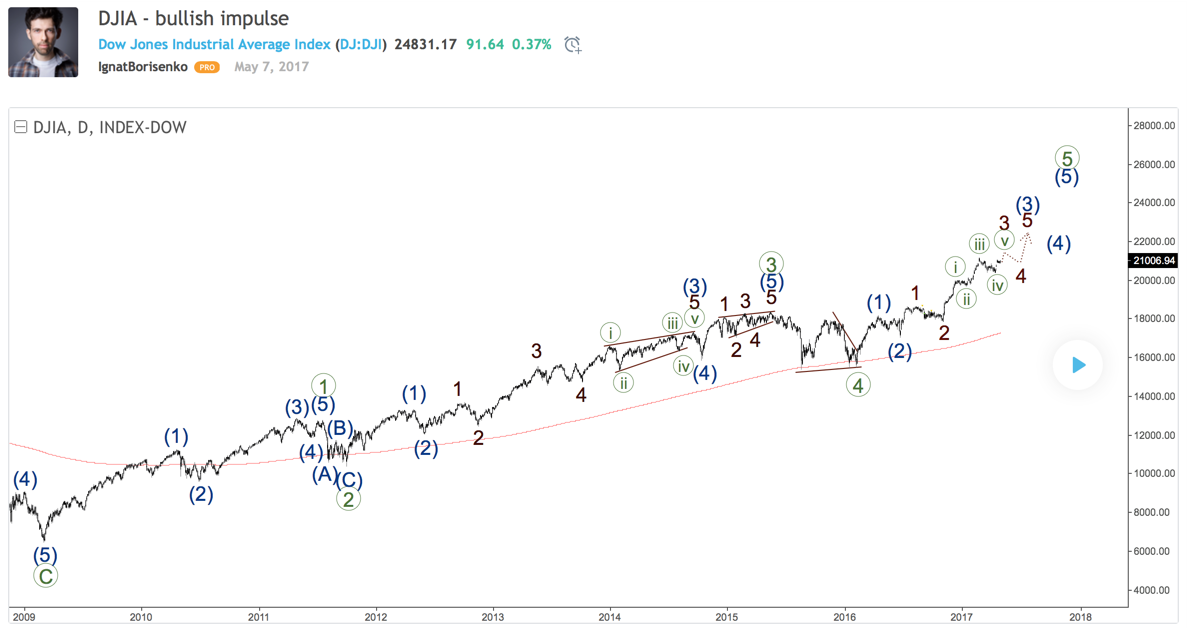
So, the trend is still bullish, and you can see the current wave count below.

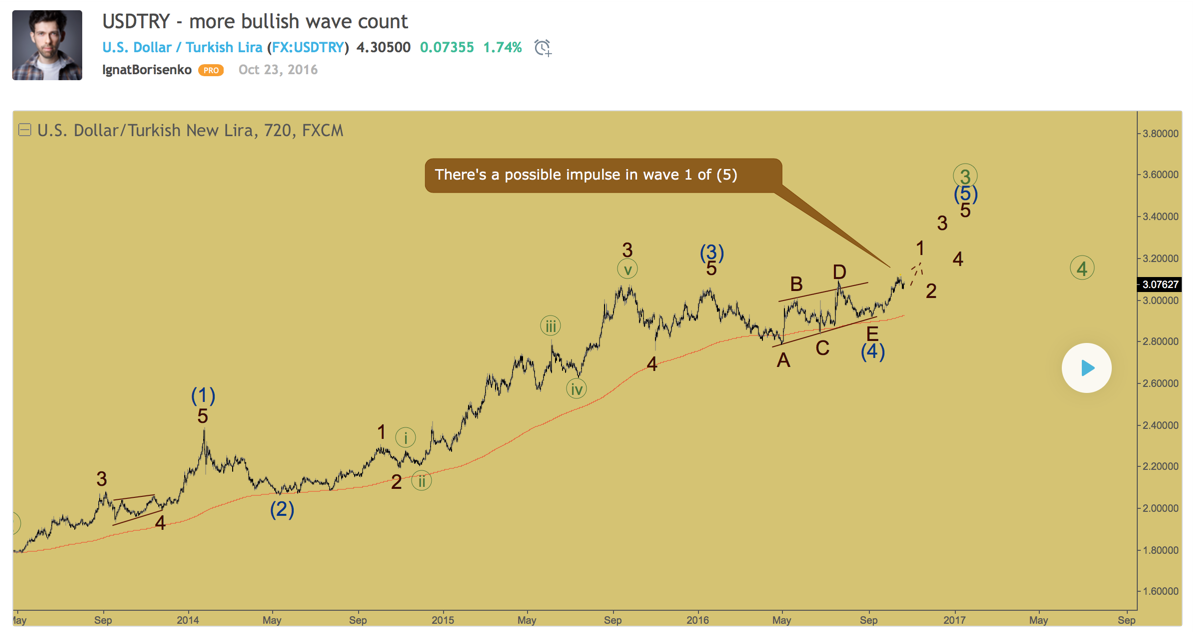
The second story is USD/TRY. In October 2016, the fourth wave looked finished as a triangle, so we were expecting another bullish impulse, which developed in the next few months.
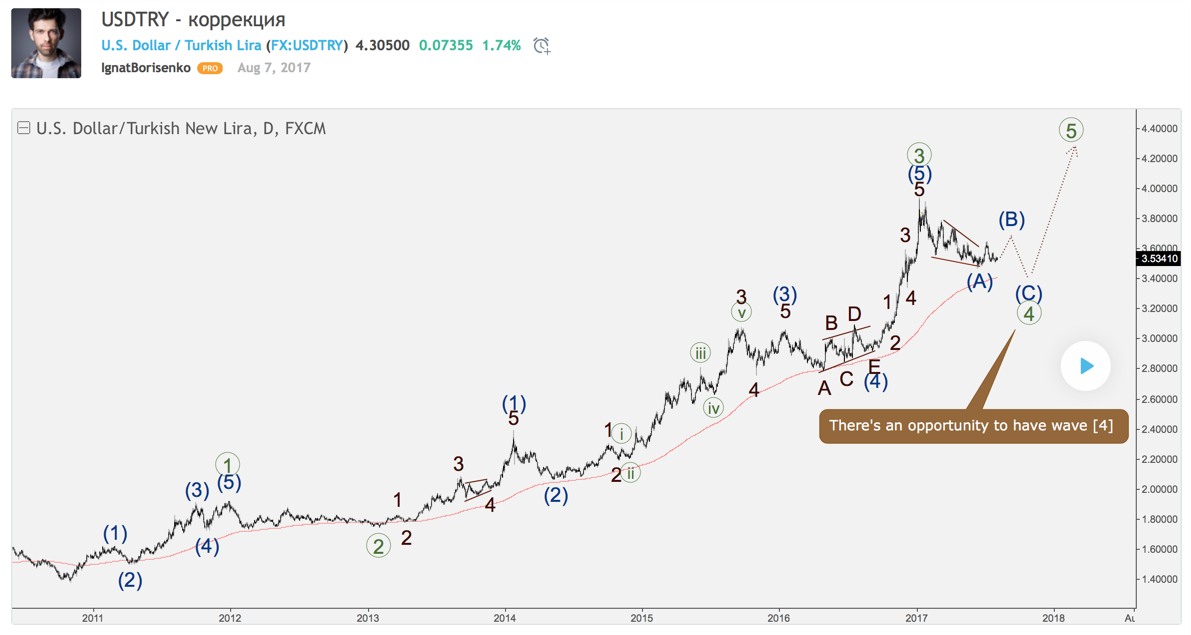
Then there was a long story with a bearish correction, which finally ended, so the bullish trend continued as expected.
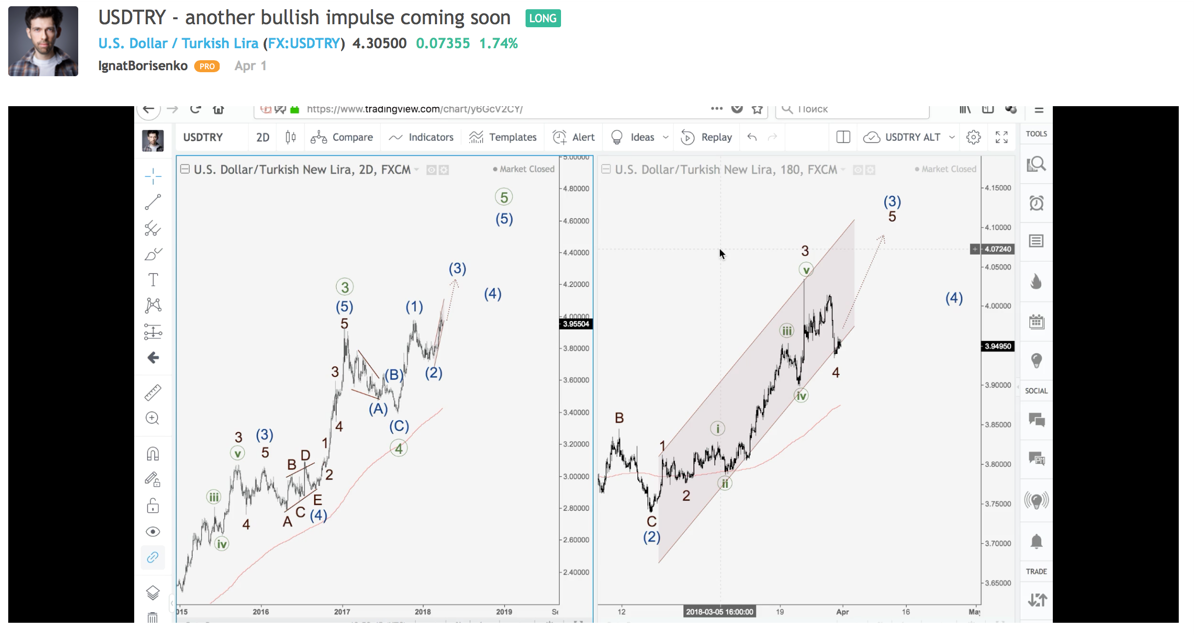
Finally, in April 2018 there was another bullish moment because of the possible ending of wave 4. So, the market went even higher.
There’re bad examples as well. However, speaking of trading, the most important thing is what you’re doing when the market is moving along the trend according to your wave count. So, we can use the EWP as a great tool to find opportunities in the markets.
In addition, there’s no obligation for you to trade any wave count you labeled or just seen on the web. You should trade only the best counts when you have a great moment to open a trade. In other words, you should wait for a good call like a hunter in the woods. And when you see the opportunity, then you do the best to trade it with best results.
It’s just the beginning. In the next articles, we’re going through the more specific rules and guidelines of the EWP.

